Question 8
The scatter graph shows information about the daily maximum temperature and the total ice cream sales for a shop over several days.
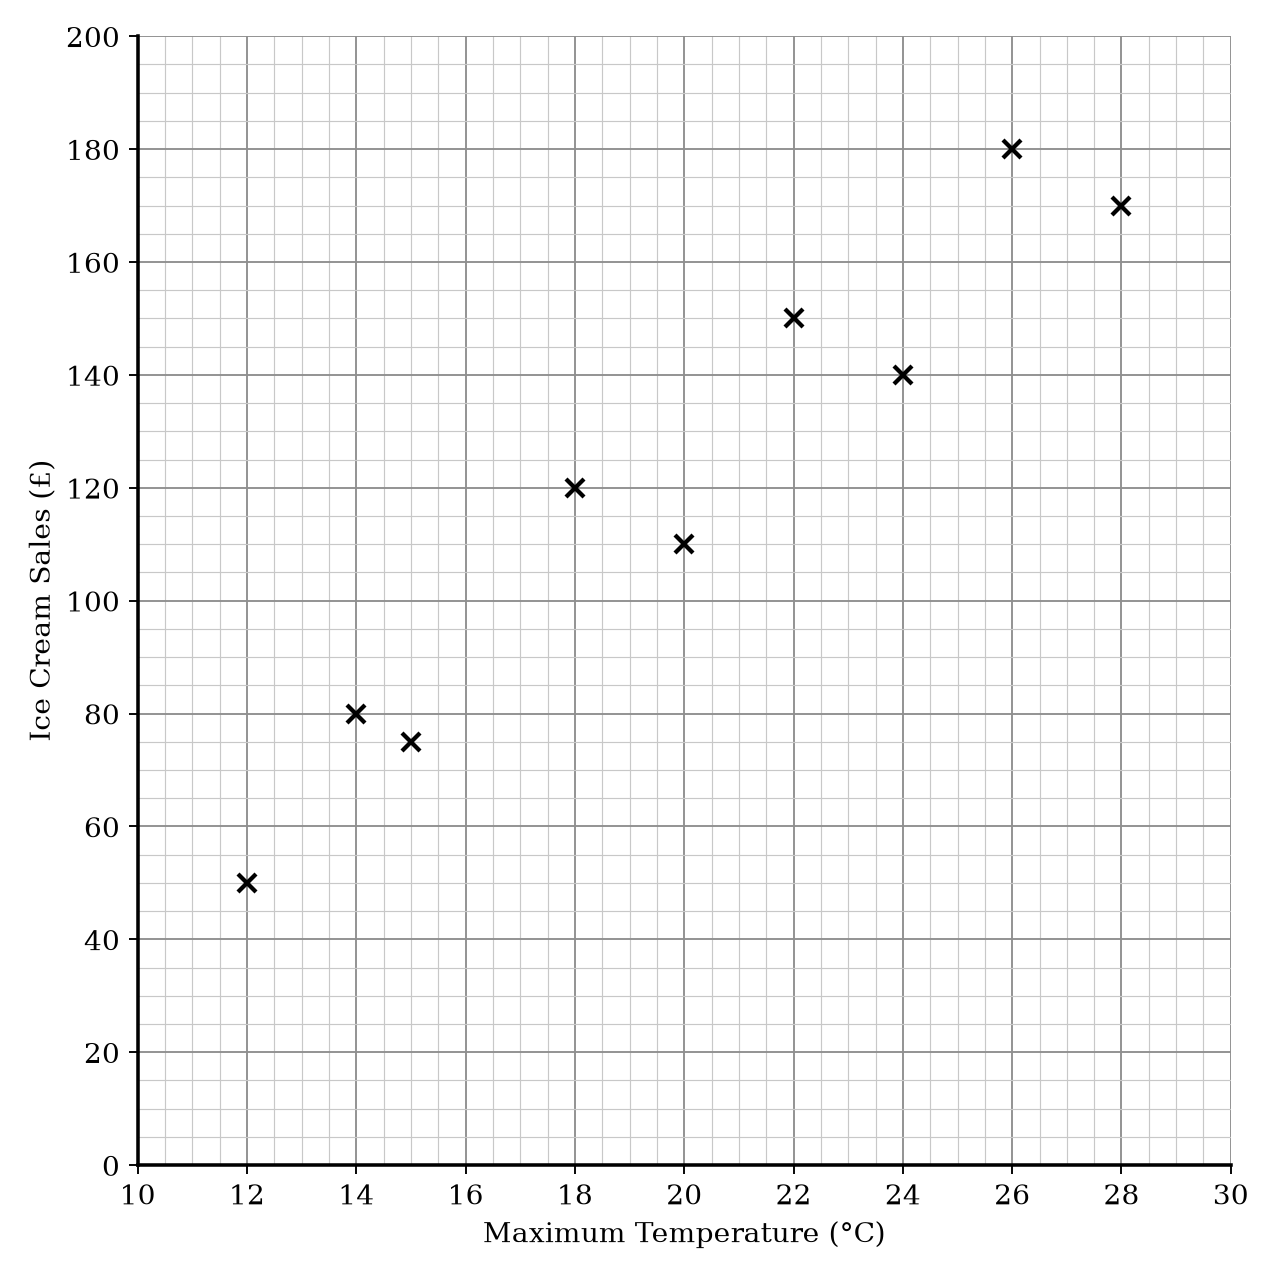
| Temperature (∘C^\circ\text{C}∘C) | Ice Cream Sales (£\pounds£) |
|---|---|
| 12 | 50 |
| 14 | 80 |
| 15 | 75 |
| 18 | 120 |
| 20 | 110 |
| 22 | 150 |
| 24 | 140 |
| 26 | 180 |
| 28 | 170 |
The table shows the temperature and sales for two more days.
| Temperature (∘C^\circ\text{C}∘C) | 21 | 25 |
| Ice Cream Sales (£\pounds£) | 130 | 165 |
a.[1]
Show this information on the scatter graph.
b.[2]
On another day, the ice cream sales were £\pounds£100. Use the scatter graph to estimate the maximum temperature on this day.
Scatter Graphs Questions
54 exam-style questions on WJEC GCSE Maths Scatter Graphs. Each one has a worked solution and a mark scheme showing where the marks go.