What a box plot shows
What a box plot shows
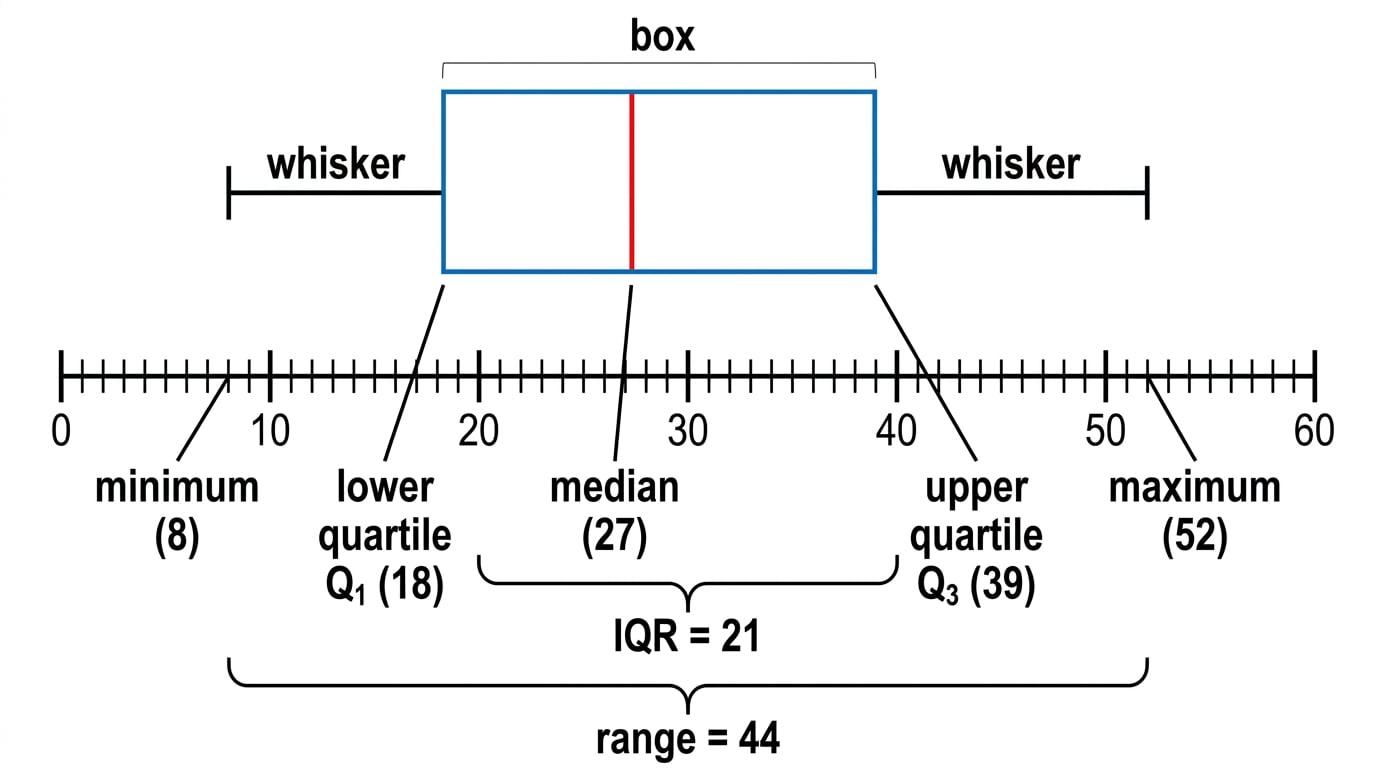
A distribution is the way a set of data values is spread out. A box plot is a quick way to show that spread on a number line. It uses the five-number summary: minimum, lower quartile Q1Q_1Q1, median, upper quartile Q3Q_3Q3, and maximum.
Box Plots Lesson
Step-by-step lessons on OCR GCSE Maths Box Plots. Each one builds up to exam-style questions. Build fluency with number, ratio and algebra first, since geometry, probability and statistics topics rely on them, and leave extra time nearer the exam for Higher-tier problem-solving and multi-step reasoning questions.