Question 9
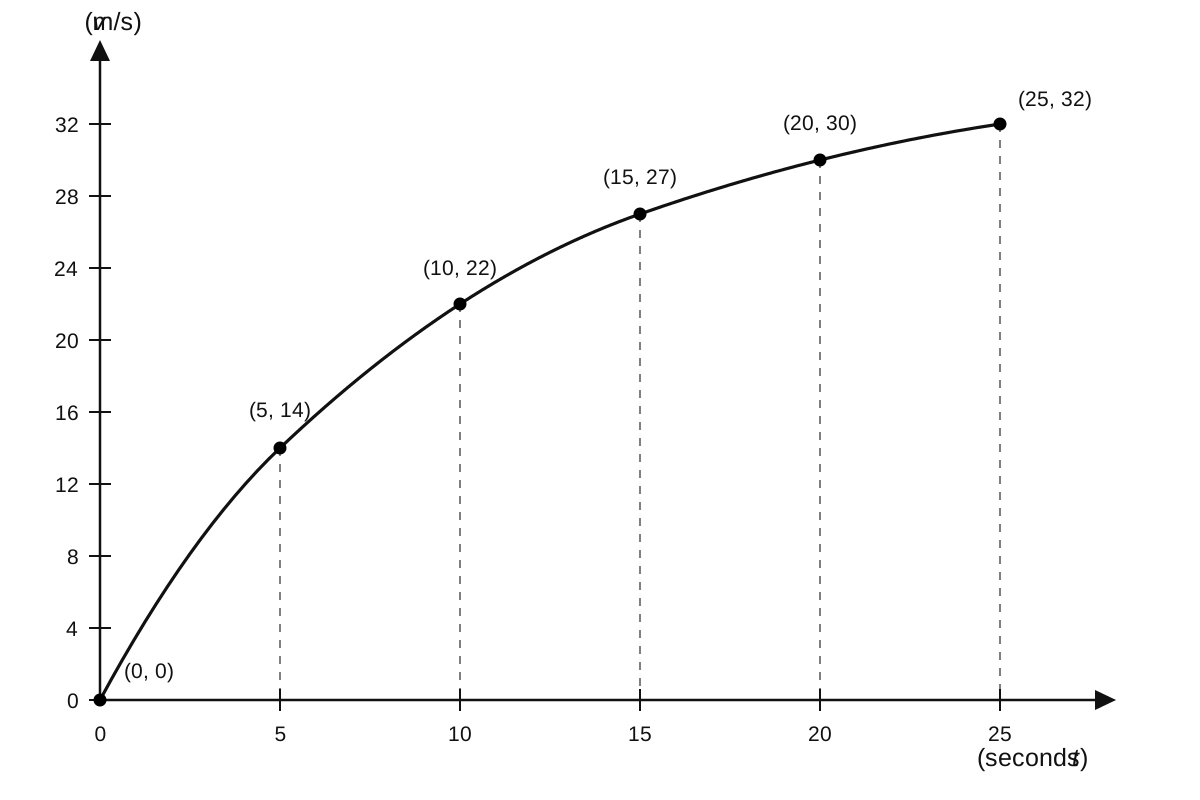
A graph represents the speed of an electric train for the first 25 seconds of its journey. The speeds, v m/sv\text{ m/s}v m/s, recorded at t=0,5,10,15,20,25t = 0, 5, 10, 15, 20, 25t=0,5,10,15,20,25 are 0,14.0,22.0,27.0,30.00, 14.0, 22.0, 27.0, 30.00,14.0,22.0,27.0,30.0, and 32.0 respectively.
a.[3]
Use 5 strips of equal width to find an estimate for the distance travelled in 25 seconds.
b.[1]
Is your answer to (a) an underestimate or an overestimate of the actual distance? Give a reason for your answer.
Velocity Time Graphs Questions
23 exam-style questions on Eduqas GCSE Maths Velocity Time Graphs. Each one has a worked solution and a mark scheme showing where the marks go.