Skip to content
MathsGenie logo
Open app

Course home

  1. GCSE
  2. Maths Eduqas
  3. Question bank

Trigonometric and Exponential Graphs

EasyMedium
12345678910111213
Question 10

The level of liquid in a processing tank, L L\,L units, varies over a long cycle given by the formula: L=12−6sin⁡(15t)L = 12 - 6\sin(15t)L=12−6sin(15t), where t t\,t is the time in hours since the start of the week.

a.

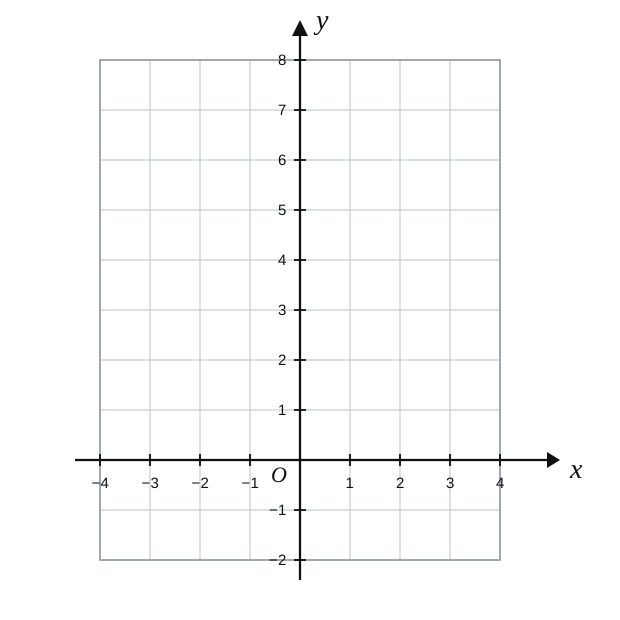
On the axes below, draw the graph of L L\,L against t t\,t for 0≤t≤240 \leq t \leq 240≤t≤24

A coordinate grid for plotting liquid level L against time t.

[4]
b.

Find the two values of ttt, where 0≤t≤480 \leq t \leq 480≤t≤48, when the liquid level is least.

[2]

Trigonometric and Exponential Graphs Questions

  1. GCSE
  2. /Maths
  3. /Trigonometric and Exponential Graphs

Practise Eduqas GCSE Maths Trigonometric and Exponential Graphs with exam-style questions for Foundation and Higher tier. 31 questions, matched to the Eduqas GCSE Maths (C300QS) specification and written in Component 1 and Component 2 style. Every question includes a full worked solution and mark scheme, so you can see where marks are awarded rather than just whether you got the answer right.

Question bank