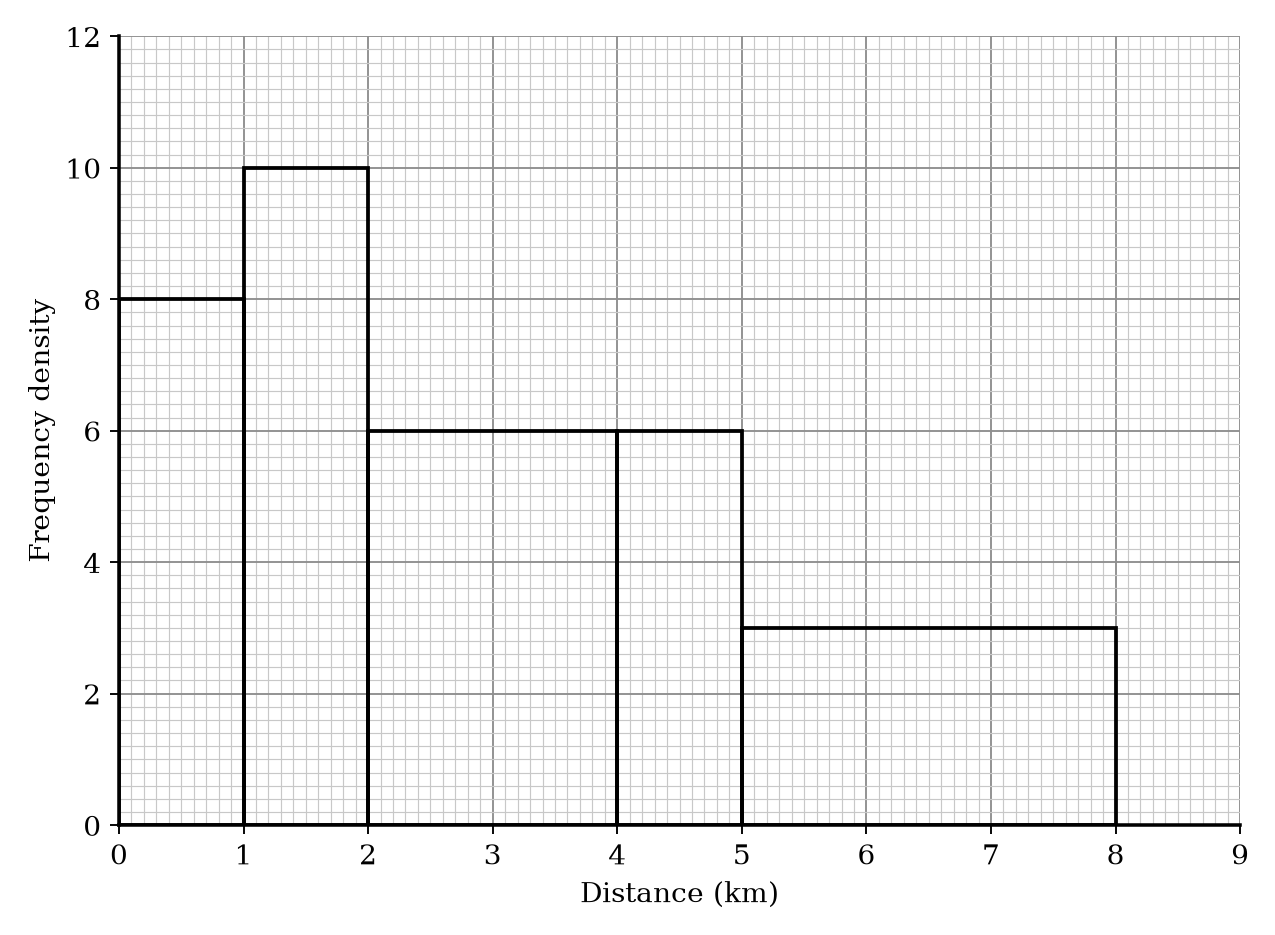
The histogram shows information about the time spent by students on a revision app.

40 students spent between 0 and 20 minutes on the app.
Work out an estimate for the number of students who spent more than 25 minutes on the app.
Explain why your answer to part a is only an estimate.
Practise Eduqas GCSE Maths Histograms with exam-style questions for Foundation and Higher tier. 28 questions, matched to the Eduqas GCSE Maths (C300QS) specification and written in Component 1 and Component 2 style. Every question includes a full worked solution and mark scheme, so you can see where marks are awarded rather than just whether you got the answer right.