Question 4
Complete the table of values for y=x2−2x−3y = x^2 - 2x - 3y=x2−2x−3
| xxx | -2 | -1 | 0 | 1 | 2 | 3 | 4 |
|---|---|---|---|---|---|---|---|
| yyy | 5 | -3 | 0 |
a.[4]
On the grid draw the graph of y=x2−2x−3y = x^2 - 2x - 3y=x2−2x−3 for values of x x\,x from -2 to 4
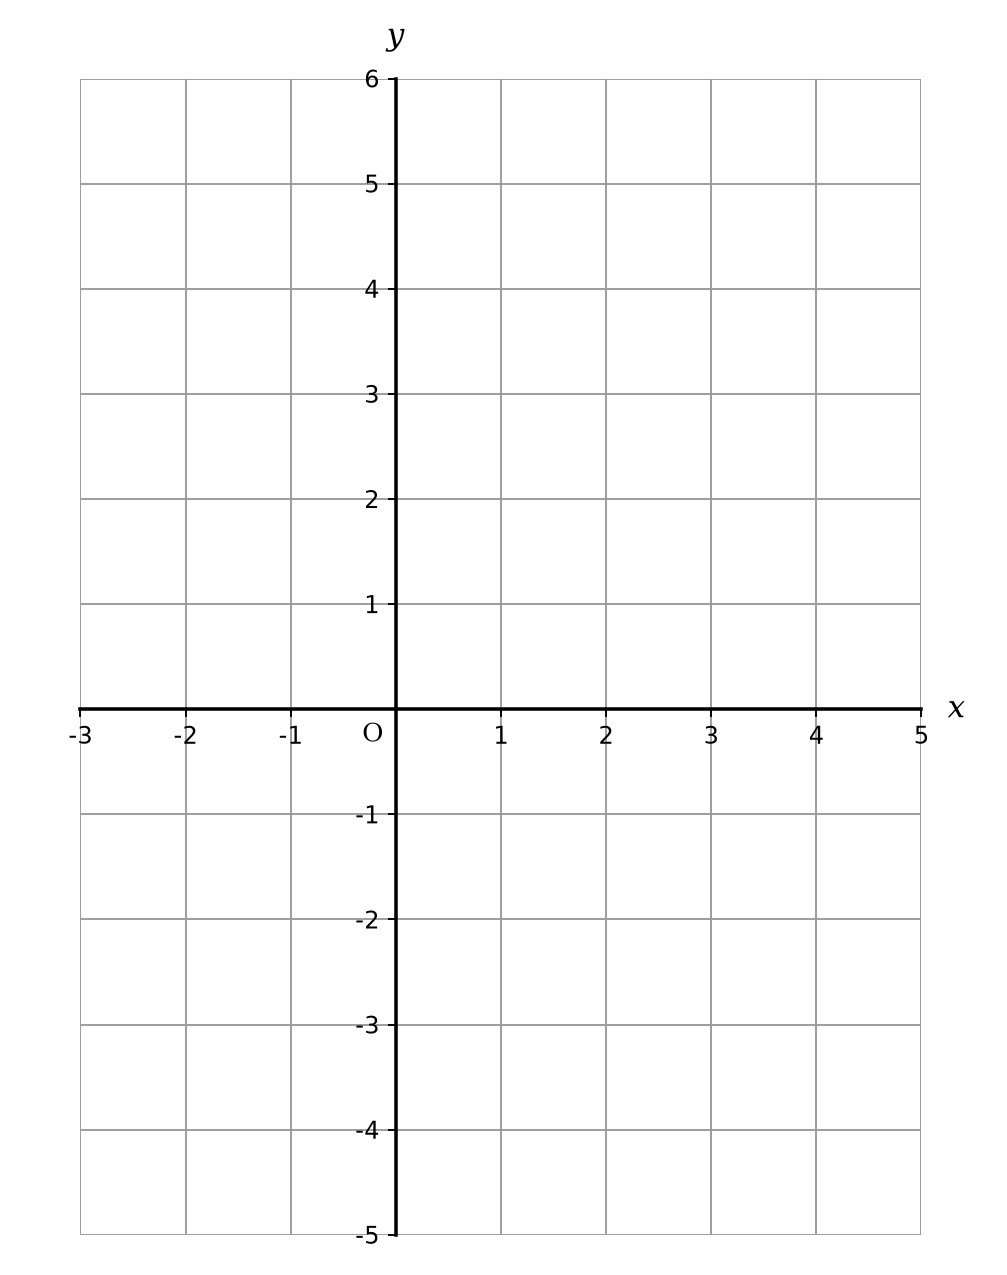
b.[2]
Use the graph to find estimates of the solutions to the equation x2−2x−3=2x^2 - 2x - 3 = 2x2−2x−3=2
Drawing Quadratic Graphs Questions
25 exam-style questions on Eduqas GCSE Maths Drawing Quadratic Graphs. Each one has a worked solution and a mark scheme showing where the marks go.