Question 11
Here is a bar chart showing the average daily hours of sunshine in Brighton.
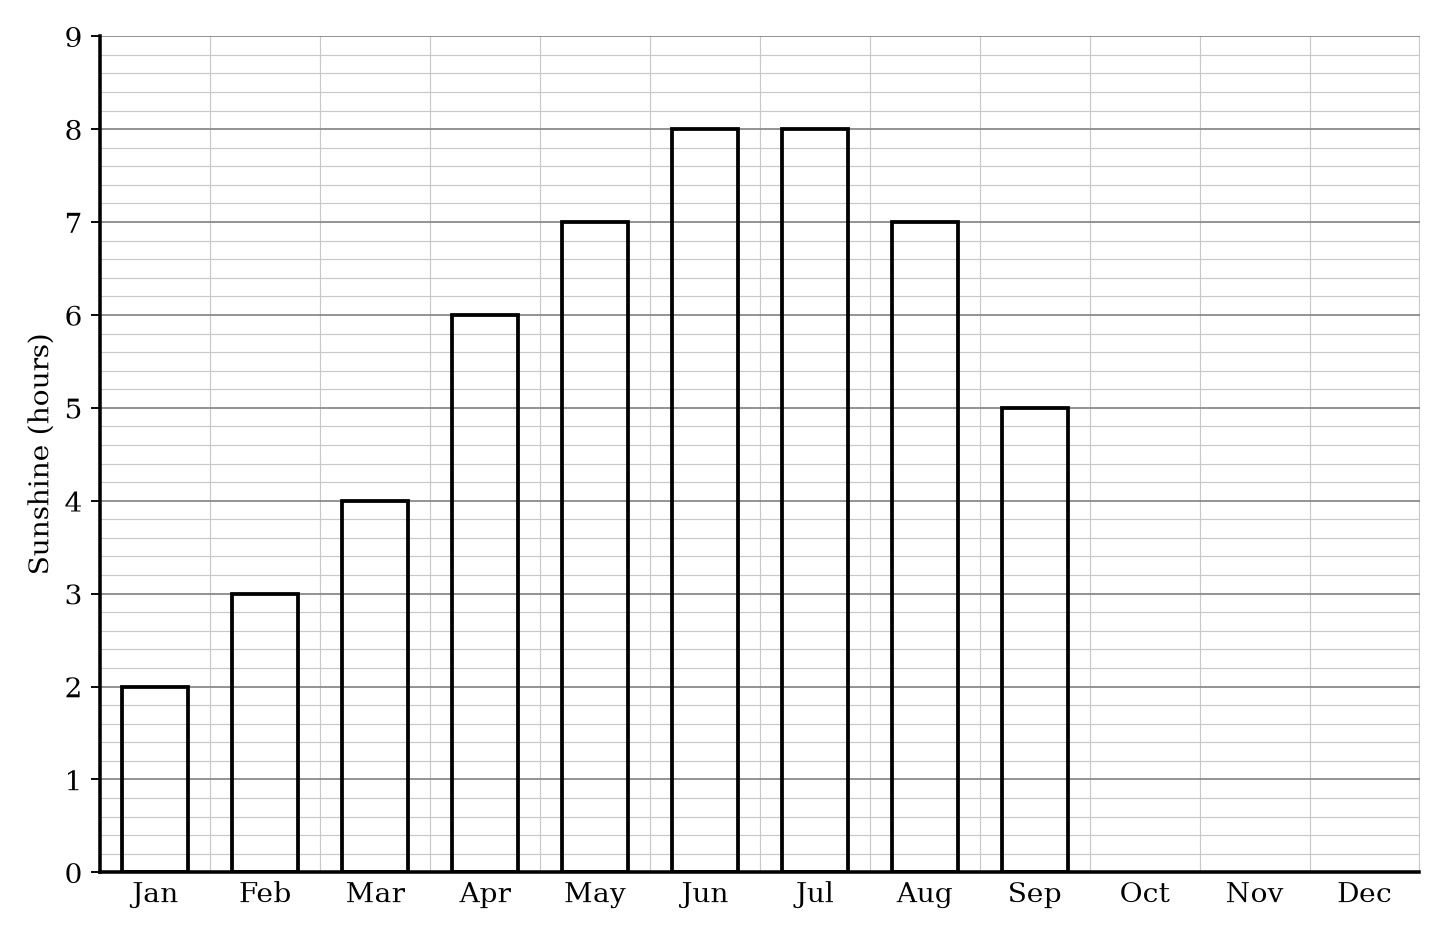
| Month | Sunshine (hours) |
|---|---|
| Jan | 2 |
| Feb | 3 |
| Mar | 4 |
| Apr | 6 |
| May | 7 |
| Jun | 8 |
| Jul | 8 |
| Aug | 7 |
| Sep | 5 |
| Oct | |
| Nov | |
| Dec |
Here are the average daily sunshine hours for October, November and December.
| Month | Sunshine |
|---|---|
| October | 4 hours4\text{ hours}4 hours |
| November | 3 hours3\text{ hours}3 hours |
| December | 2 hours2\text{ hours}2 hours |
a.[2]
Complete the bar chart to show this information.
b.[1]
In which two months were the highest average daily sunshine hours recorded?
c.[1]
Work out the range of average daily sunshine hours.
Bar Charts Questions
21 exam-style questions on Eduqas GCSE Maths Bar Charts. Each one has a worked solution and a mark scheme showing where the marks go.