Question 1
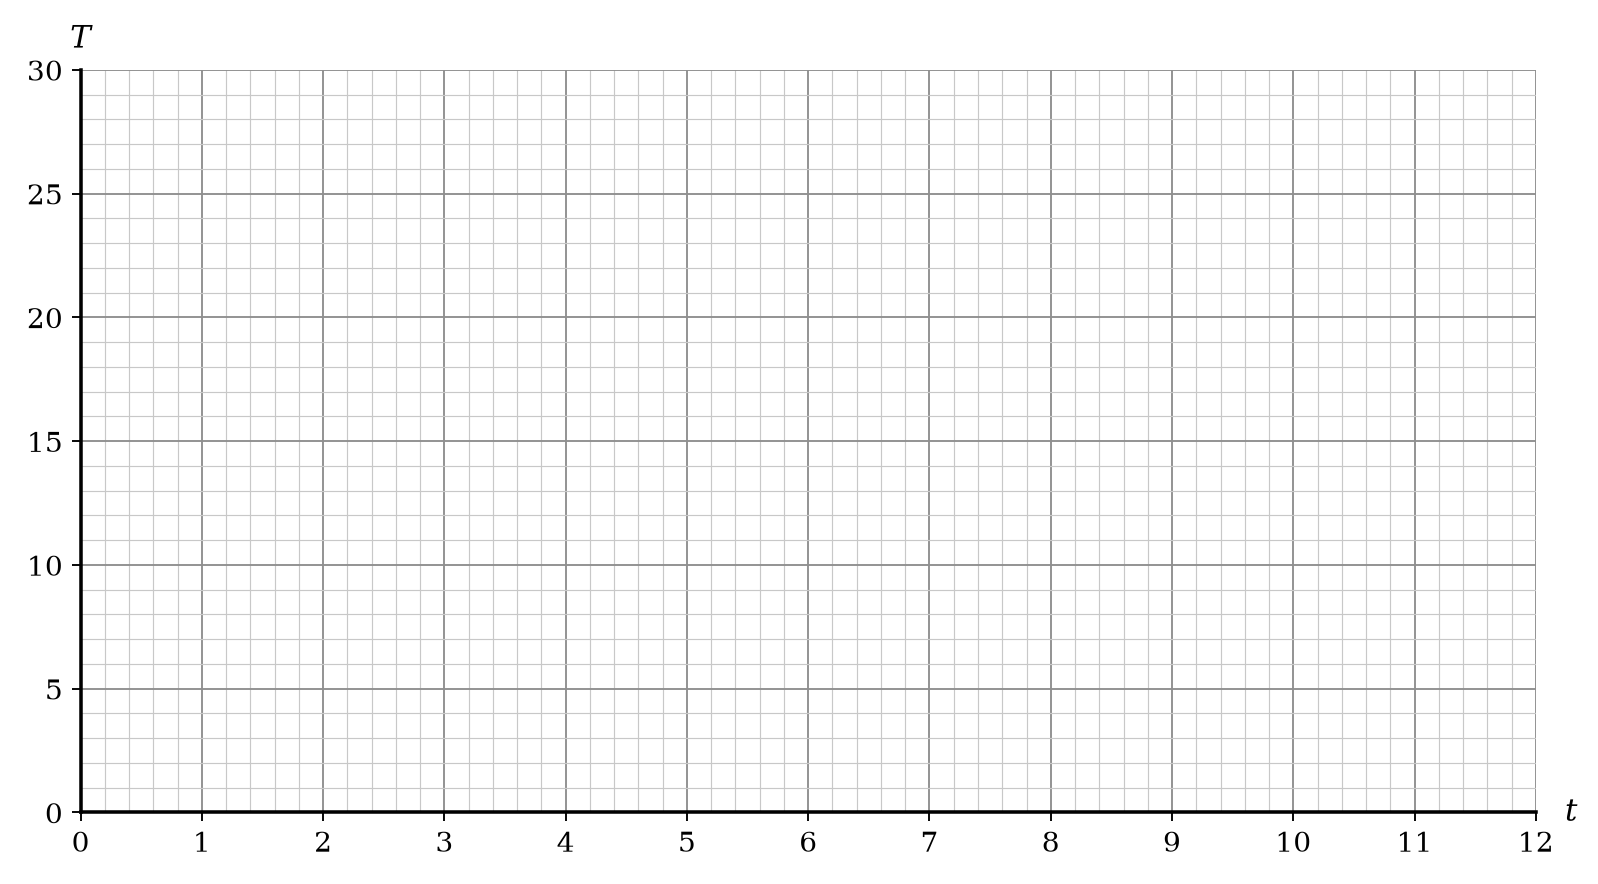
The temperature inside a greenhouse, T T\,T degrees Celsius, is modeled by the formula: T=20−10sin(30t)T = 20 - 10\sin(30t)T=20−10sin(30t), where t t\,t is the time in hours after midnight.
a.[4]
On the axes below, draw the graph of T T\,T against t t\,t for 0≤t≤120 \leq t \leq 120≤t≤12
b.[2]
Find the two values of ttt, where 0≤t≤240 \leq t \leq 240≤t≤24, when the temperature is least.
Trigonometric and Exponential Graphs Questions
30 exam-style questions on Edexcel GCSE Maths Trigonometric and Exponential Graphs. Each one has a worked solution and a mark scheme showing where the marks go.