Question 11
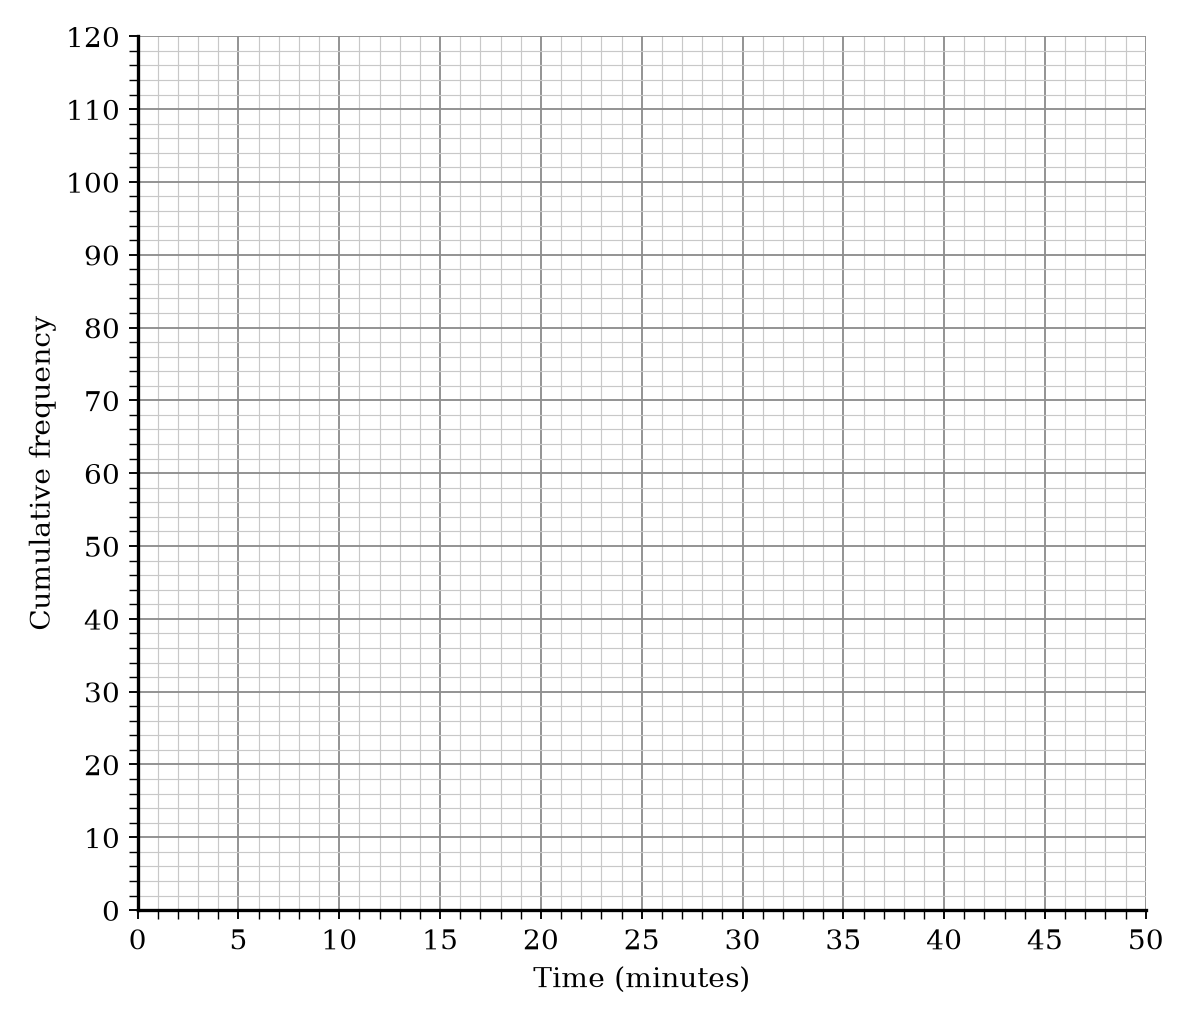
The frequency table shows the times taken for 120 runners to complete a local race.
a.
[2]
On the grid, plot a cumulative frequency graph for this information.
| Time (t t\,t minutes) | Frequency |
|---|---|
| 0<t≤100 < t \le 100<t≤10 | 12 |
| 10<t≤2010 < t \le 2010<t≤20 | 28 |
| 20<t≤3020 < t \le 3020<t≤30 | 42 |
| 30<t≤4030 < t \le 4030<t≤40 | 23 |
| 40<t≤5040 < t \le 5040<t≤50 | 15 |
b.[1]
Find an estimate for the number of runners who took more than 45 minutes.
Cumulative Frequency Questions
21 exam-style questions on Edexcel GCSE Maths Cumulative Frequency. Each one has a worked solution and a mark scheme showing where the marks go.