When we have an equation with two different unknowns, like y = 2x + 1, we cannot solve the equation.
We can instead find pairs of x and y values that make the left side equal the right side
We can use a table of values to show the number pairs:
| x | 0 | 1 | 2 | 3 |
|---|---|---|---|---|
| y |
To complete this table of values, for y = 2x + 1, we need to find out the value of y when x = 0, when x = 1, when x = 2 and when x = 3
We do this using substitution
When x = 0
y = 2(0) + 1
y = 1
When x = 1
y = 2(1) + 1
y = 3
When x = 2
y = 2(2) + 1
y = 5
When x = 3
y = 2(3) + 1
y = 7
We can use these values to complete the table
| x | 0 | 1 | 2 | 3 |
|---|---|---|---|---|
| y | 1 | 3 | 5 | 7 |
Example 1: Complete the table of values for x + y = 6
| x | 0 | 1 | 2 | 3 |
|---|---|---|---|---|
| y |
We can find the y values using substitution:
When x = 0
0 + y = 6
y = 6
When x = 1
1 + y = 6
y = 5
When x = 2
2 + y = 6
y = 4
When x = 3
3 + y = 6
y = 3
We can now complete the table:
| x | 0 | 1 | 2 | 3 |
|---|---|---|---|---|
| y | 6 | 5 | 4 | 3 |
Example 2: Complete the table of values for y = 3x - 5
| x | -3 | -2 | -1 | 0 | 1 | 2 | 3 |
|---|---|---|---|---|---|---|---|
| y |
In this example we have negative x values in the table. It is often easier to start with the positive x values:
When x = 3
y = 3(3) - 5
y = 4
When x = 2
y = 3(2) - 5
y = 1
When x = 1
y = 3(1) - 5
y = -2
When x = 0
y = 3(0) - 5
y = -5
| x | -3 | -2 | -1 | 0 | 1 | 2 | 3 |
|---|---|---|---|---|---|---|---|
| y | -5 | -2 | 1 | 4 |
We can notice a pattern in these y values, they are going up by 3 each time (from left to right or down by 3 each time from right to left).
We can expect that for x = -1, y = -8
When x = -2, y = -11
and when x = -3, y = -14
Substituting gives:
When x = -1
y = 3(-1) - 5
y = -8
When x = -2
y = 3(-2) - 5
y = -11
When x = -3
y = 3(-3) - 5
y = -14
If we make a mistake in our calculations we will be able to notice as our values would not fit the pattern.
| x | -3 | -2 | -1 | 0 | 1 | 2 | 3 |
|---|---|---|---|---|---|---|---|
| y | -14 | -11 | -8 | -5 | -2 | 1 | 4 |
Try these:
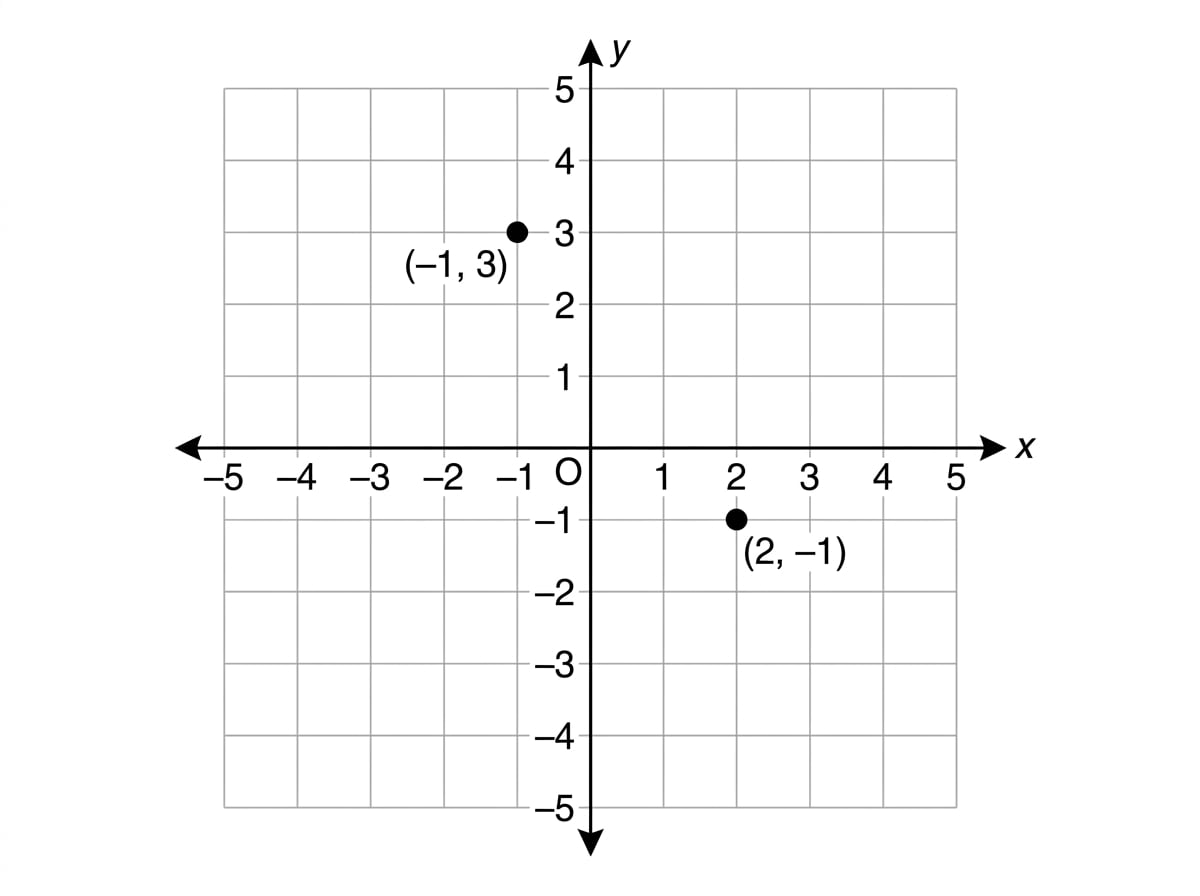
We can use a table of values to draw a graph. Each pair of values become a set of coordinates (x,y).
Example: Here is the table of values for y = 2x - 3
draw the graph for y = 2x - 3
| x | -3 | -2 | -1 | 0 | 1 | 2 | 3 |
|---|---|---|---|---|---|---|---|
| y | -9 | -7 | -5 | -3 | -1 | 1 | 3 |
On a graph we will plot the coordinates:
(-3,-9), (-2,-7), (-1,-5), (0,-3), (1,-1), (2,1) and (3,3)
We join the points up with a straight line.
Example: Draw the graph for y = 3x + 1
Here we have not been given a table of values.
We can create a table of values. We can see that the x values on the graph are -2, -1, 0, 1 and 2. We can use these for our table of values:
| x | -2 | -1 | 0 | 1 | 2 |
|---|---|---|---|---|---|
| y |
We can now complete our table bu substituting our x values into the equation:
When x = 2
y = 3(2) + 1
y = 7
When x = 1
y = 3(1) + 1
y = 4
When x = 0
y = 3(0) + 1
y = 1
When x = -1
y = 3(-1) + 1
y = -2
When x = -2
y = 3(-2) + 1
y = -5
We can use these values to complete the table
| x | -2 | -1 | 0 | 1 | 2 |
|---|---|---|---|---|---|
| y | -5 | -2 | 1 | 4 | 7 |
The next step is to plot the coordinates:
(-2,-5), (-1,-2), (0,1), (1,4) and (2,7)
And finally we use a ruler to draw the line