Revision notes for Edexcel GCSE Maths Stem and Leaf. Open the guide for explanations and worked examples. Written against the Edexcel GCSE Maths (1MA1) specification, so the content matches what's examinable rather than general Maths background.
A set of data means a list of values, such as heights, times, masses or scores.
Place value means the value of a digit depending on where it is in the number. For example, in 47, the 4 means 40 and the 7 means 7.
A stem and leaf diagram uses place value to organise data neatly.
Stem, leaf and key
The stem is the first part of the number, usually the tens digit or all digits except the last one.
The leaf is the last digit.
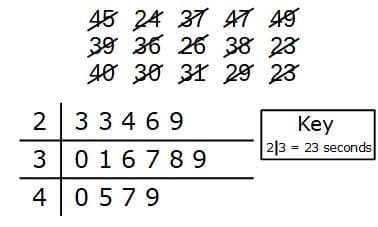
The key explains exactly what one stem and one leaf mean, including the units.
For example, if the key is 4 | 7 = 47 seconds, then stem 4 and leaf 7 make 47 seconds.

Splitting heights into stems and leaves
Split these heights: 153 cm, 168 cm and 190 cm.

For 153 cm, keep 15 as the stem and use 3 as the leaf.
For 168 cm, keep 16 as the stem and use 8 as the leaf.
For 190 cm, keep 19 as the stem and use 0 as the leaf. The 0 leaf is important.
A suitable key is 15 | 3 = 153 cm.
An ordered stem and leaf diagram has the leaves in each row written from smallest to largest.
Main rule
Each value in the data must appear exactly once as a leaf. Repeated values must be repeated in the diagram.
Drawing an ordered diagram
Draw an ordered stem and leaf diagram for these plant heights:

28, 33, 36, 41, 44, 39, 52, 50, 47, 34, 42, 46, 55, 31, 38
Look at the tens digits. The stems needed are 2, 3, 4 and 5.
Put each units digit into the correct row. For example, 47 goes on stem 4 with leaf 7.
Write the leaves in order in each row:
| Stem | Leaves |
|---|---|
| 2 | 8 |
| 3 | 1 3 4 6 8 9 |
| 4 | 1 2 4 6 7 |
| 5 | 0 2 5 |
Add a key: 3 | 1 = 31 cm.
Count the leaves. There are 15 leaves, matching the 15 heights.
Not ordering the leaves
Do not leave a row like 4 | 7 1 2. In an ordered diagram it should be 4 | 1 2 7. Repeated leaves stay in, so 3 | 8 8 means two values of 38.

Check your count
At the end, count the leaves and compare with the number of values in the question. This catches missing or extra numbers.
Because an ordered stem and leaf diagram is already in order, you can read the values from left to right, row by row.
Median and range
The median is the middle value when the data is in order.
If there are two middle values, the median is halfway between them.
The range is the largest value minus the smallest value.
Finding the range and median
This diagram shows some ages. The key is 1 | 8 = 18 years.

Read the ordered diagram:
| Stem | Leaves |
|---|---|
| 1 | 8 9 |
| 2 | 1 2 5 6 8 |
| 3 | 0 3 4 |
Count the leaves. There are 10 ages.
Find the range. The smallest age is 18 and the largest age is 34, so the range is 34 - 18 = 16 years.
Since there are 10 ages, there are two middle values: the 5th and 6th values.
Count through the diagram: the 5th value is 25 and the 6th value is 26.
The median is halfway between 25 and 26, so the median is 25.5 years.
Assuming the median changes
If a new high score is added, do not just say the median increases. Put the new value in order and find the middle again; the median may stay the same.
Sometimes the data has one decimal place, such as masses in kg. The key becomes very important.
Use the key for decimals
With decimals, 2 | 9 could mean 2.9 kg, not 29 kg. The key tells you the value of each leaf.
A decimal stem and leaf diagram
Draw an ordered diagram for these masses:

1.4 kg, 3.0 kg, 2.6 kg, 3.4 kg, 1.7 kg, 2.2 kg, 4.1 kg, 3.4 kg, 2.9 kg
Use the whole number as the stem and the tenths digit as the leaf.
Write the ordered diagram:
| Stem | Leaves |
|---|---|
| 1 | 4 7 |
| 2 | 2 6 9 |
| 3 | 0 4 4 |
| 4 | 1 |
Add a key: 2 | 6 = 2.6 kg.
There are 9 masses, so the median is the 5th value.
Reading from the diagram, the 5th value is 2.9 kg, so the median mass is 2.9 kg.
If someone is chosen at random, each person has an equal chance of being chosen.
Probability
The probability of a chosen value having a feature is P=number wantedtotal numberP=\frac{\text{number wanted}}{\text{total number}}P=total numbernumber wanted when each value is equally likely.
Probability from scores
A student is chosen at random from this ordered stem and leaf diagram of test scores. Find the probability that the score is more than 80. The key is 6 | 4 = 64 marks.

Read the diagram:
| Stem | Leaves |
|---|---|
| 5 | 8 |
| 6 | 1 4 9 |
| 7 | 0 2 7 8 |
| 8 | 1 5 6 |
| 9 | 0 3 |
Count all the leaves. There are 13 students.
“More than 80” means 81, 85, 86, 90 and 93. There are 5 scores wanted.
The probability is P=513P=\frac{5}{13}P=135.
Inequality words
“More than 80” does not include 80. “Younger than 30” means 29 or below.
In the exam
Draw the stems first, then add the leaves and order each row.
Always write a key with units, for example 4 | 7 = 47 seconds.
Count the leaves to check you have used every value, then answer median, range or probability questions from the ordered diagram.
Check yourself
If the key is 15 | 6 = 156 grams, what number is 17 | 2?
In an ordered diagram, why should the leaves in each row go from smallest to largest?
How would you find the median if there are 12 values?
Test yourself with 5 quick questions on this guide. Answer them all correctly to complete it.
Test yourself on this topic, or move on to the next guide.
How was this guide?