Question 6
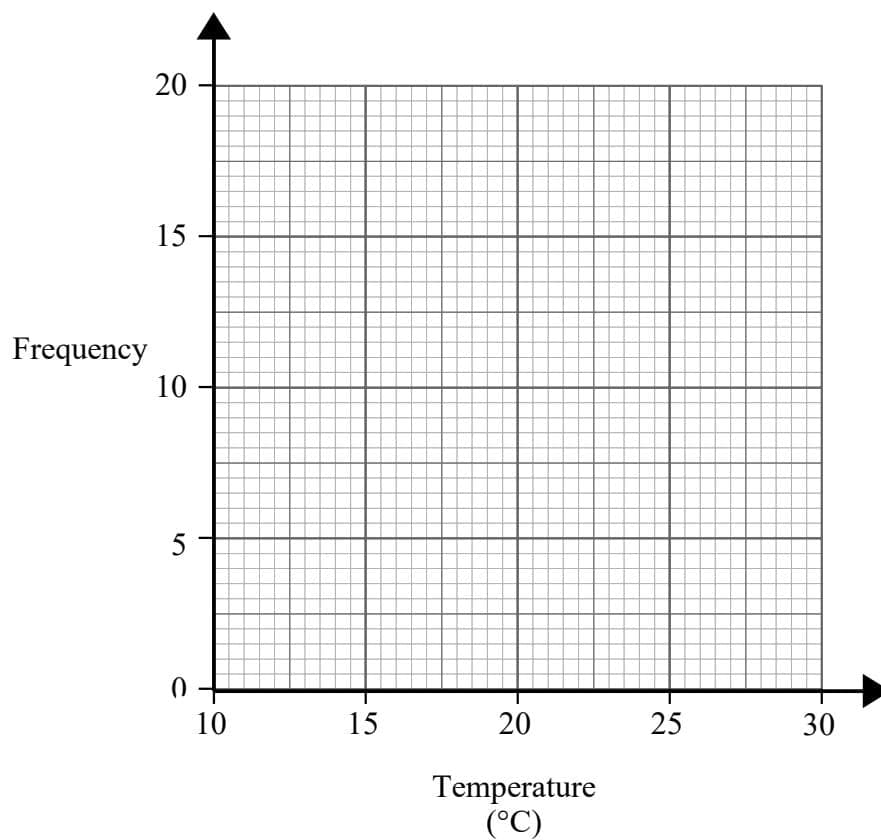
The frequency table shows the temperature, in degrees, of 30 days.
| Temperature (∘C^{\circ}\text{C}∘C) | Frequency |
|---|---|
| 10<t≤1410 < t \leq 1410<t≤14 | 1 |
| 14<t≤1814 < t \leq 1814<t≤18 | 4 |
| 18<t≤2218 < t \leq 2218<t≤22 | 16 |
| 22<t≤2622 < t \leq 2622<t≤26 | 7 |
| 26<t≤3026 < t \leq 3026<t≤30 | 2 |
Draw a frequency polygon to show this information.
Frequency Polygons Questions
27 exam-style questions on Edexcel GCSE Maths Frequency Polygons. Each one has a worked solution and a mark scheme showing where the marks go.