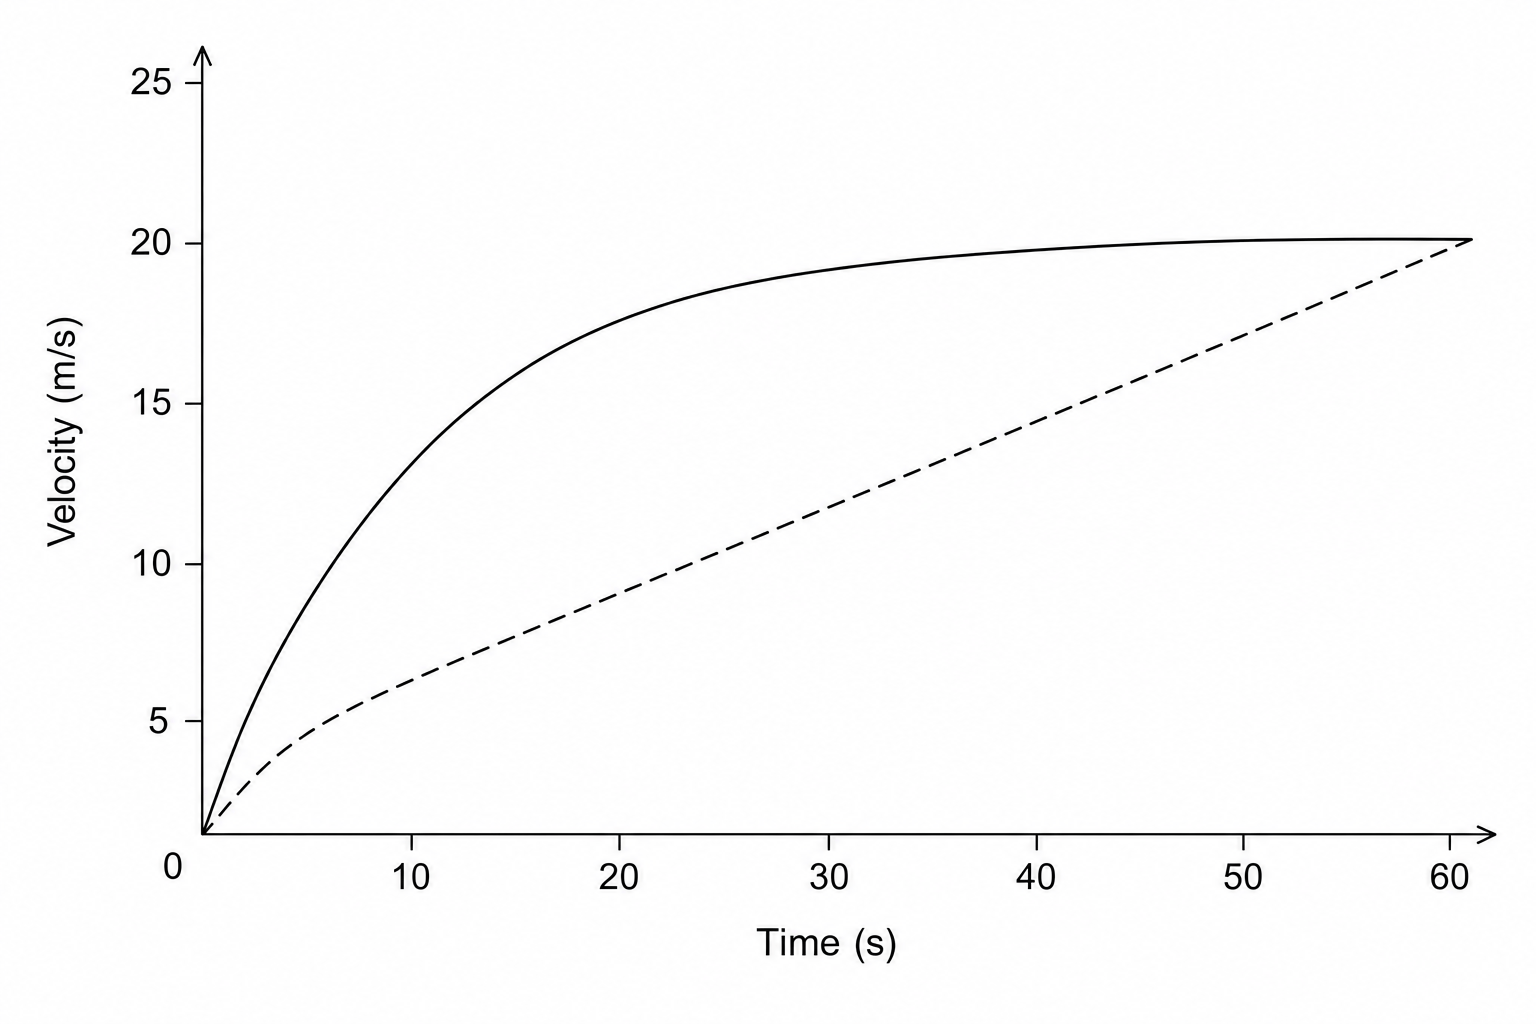
The velocity-time graph shows the speed of a delivery van as it pulls away from a stop over 60 seconds.
a.[2]
Work out the average acceleration during the 60 seconds.
Give the units of your answer.
b.[2]
Estimate the time during the 60 seconds when the instantaneous acceleration equals the average acceleration.
You must show your working on the graph.