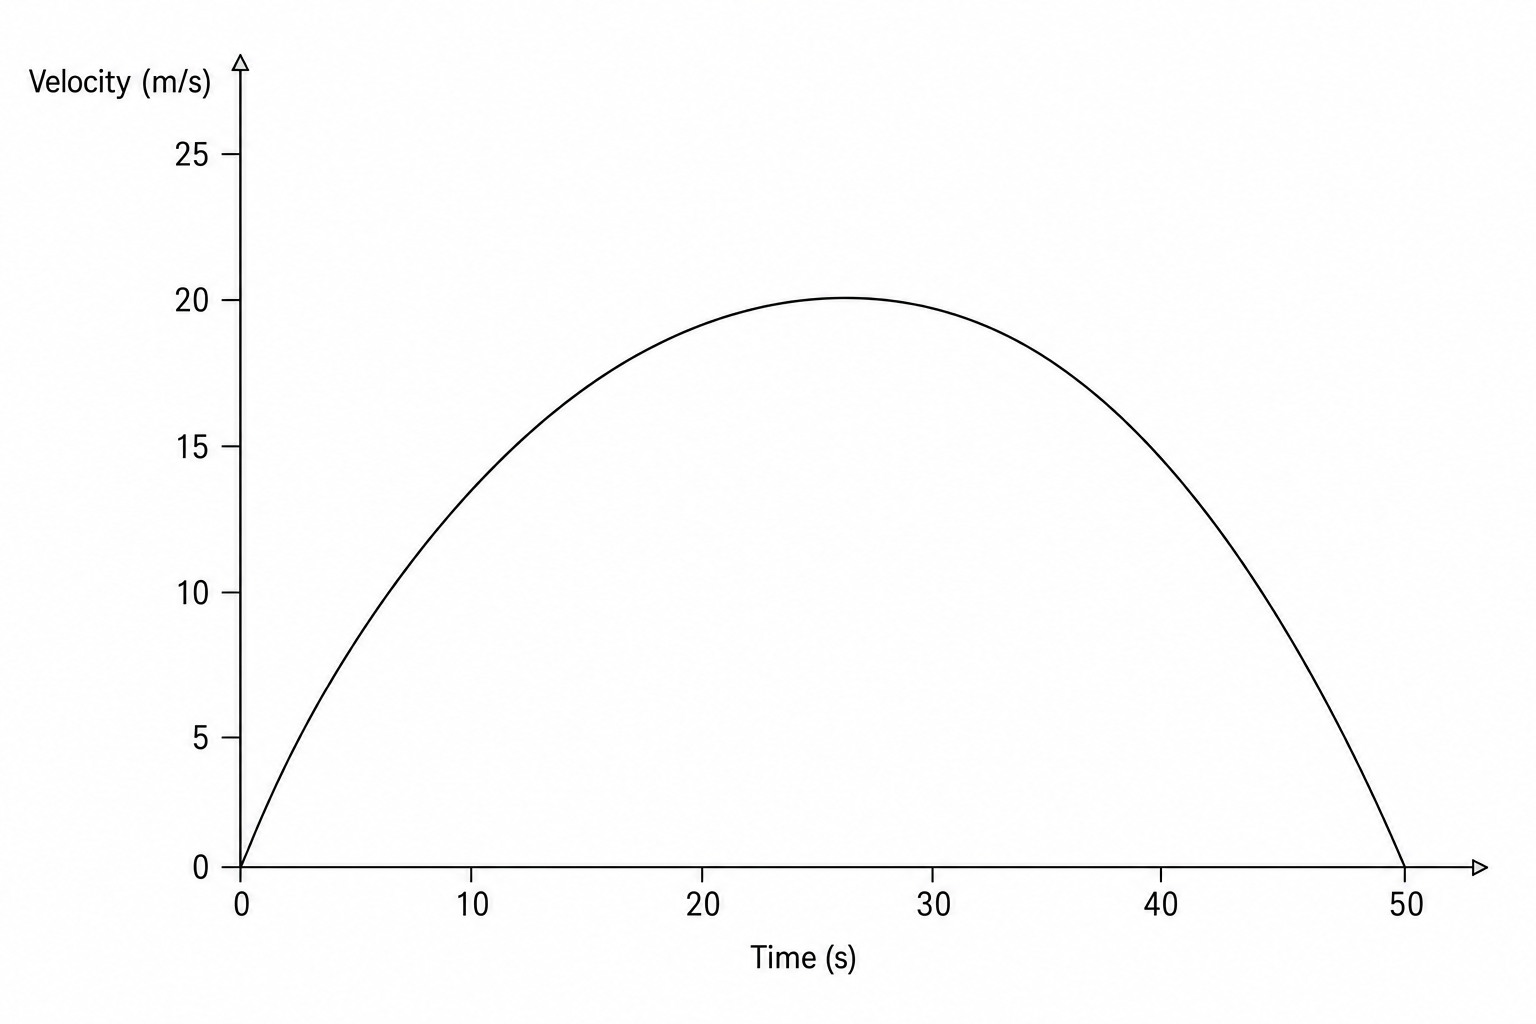
Here is the velocity-time graph of a car for 50 seconds.
a.[2]
Work out the average acceleration during the 50 seconds.
Give the units of your answer.
b.[2]
Estimate the time during the 50 seconds when the instantaneous acceleration = the average acceleration. You must show your working on the graph.
Velocity Time Graphs Questions
Practise AQA GCSE Maths Velocity Time Graphs with exam-style questions for Foundation and Higher tier. 28 questions, matched to the AQA GCSE Maths (8300) specification and written in Paper 1, Paper 2 and Paper 3 style. Every question includes a full worked solution and mark scheme, so you can see where marks are awarded rather than just whether you got the answer right.