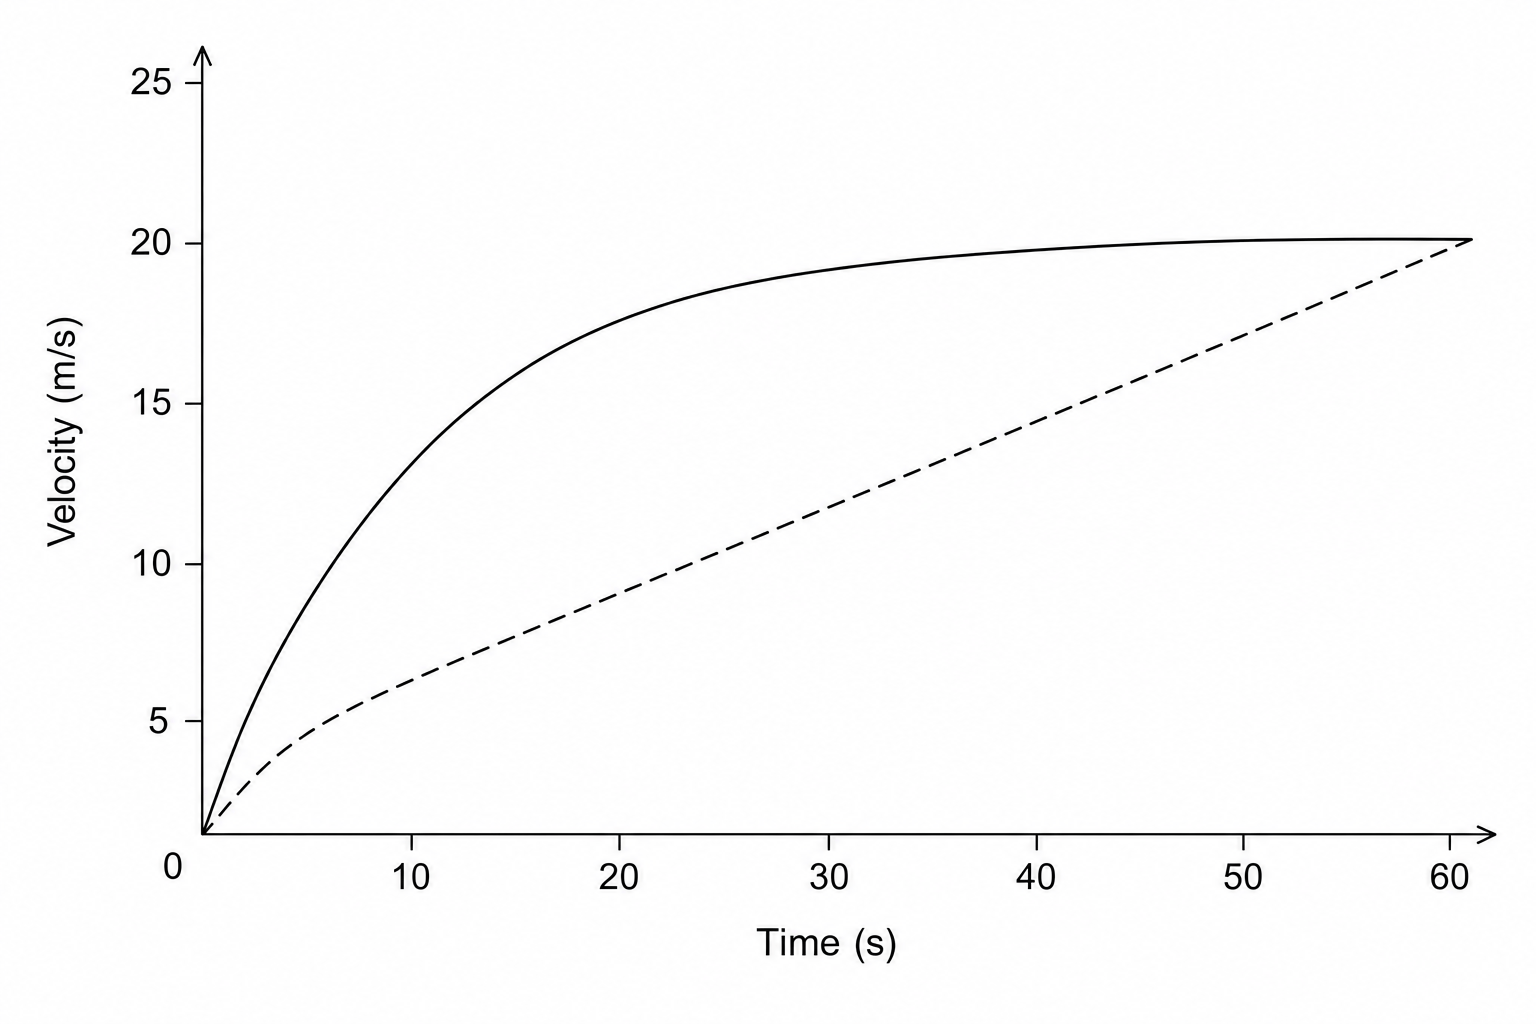
The velocity-time graph shows the speed of a delivery van as it pulls away from a stop over 60 seconds.
a.[2]
Work out the average acceleration during the 60 seconds.
Give the units of your answer.
b.[2]
Estimate the time during the 60 seconds when the instantaneous acceleration equals the average acceleration.
You must show your working on the graph.
Velocity Time Graphs Questions
Practise AQA GCSE Maths Velocity Time Graphs with exam-style questions for Foundation and Higher tier. 28 questions, matched to the AQA GCSE Maths (8300) specification and written in Paper 1, Paper 2 and Paper 3 style. Every question includes a full worked solution and mark scheme, so you can see where marks are awarded rather than just whether you got the answer right.