Question 9
The pressure p p\,p in a sound wave is modeled by the function p=cosα∘p = \cos \alpha^\circp=cosα∘, where α \alpha\,α is the phase angle in degrees.
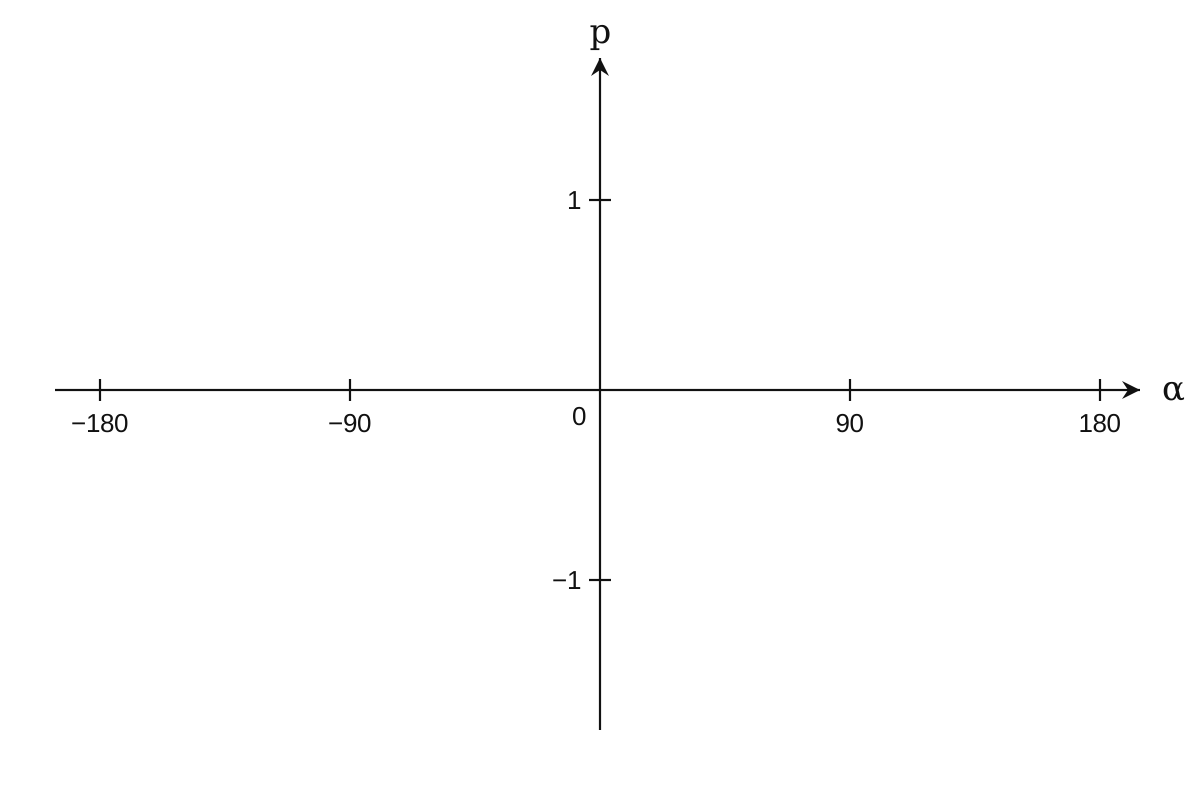
Sketch the graph of p p\,p against α \alpha\,α for −180≤α≤180-180 \leq \alpha \leq 180−180≤α≤180.
On the axes provided, sketch the graph of p=cosα∘p = \cos \alpha^\circp=cosα∘ for −180≤α≤180-180 \leq \alpha \leq 180−180≤α≤180.
Trigonometric and Exponential Graphs Questions
30 exam-style questions on AQA GCSE Maths Trigonometric and Exponential Graphs. Each one has a worked solution and a mark scheme showing where the marks go.