Histograms
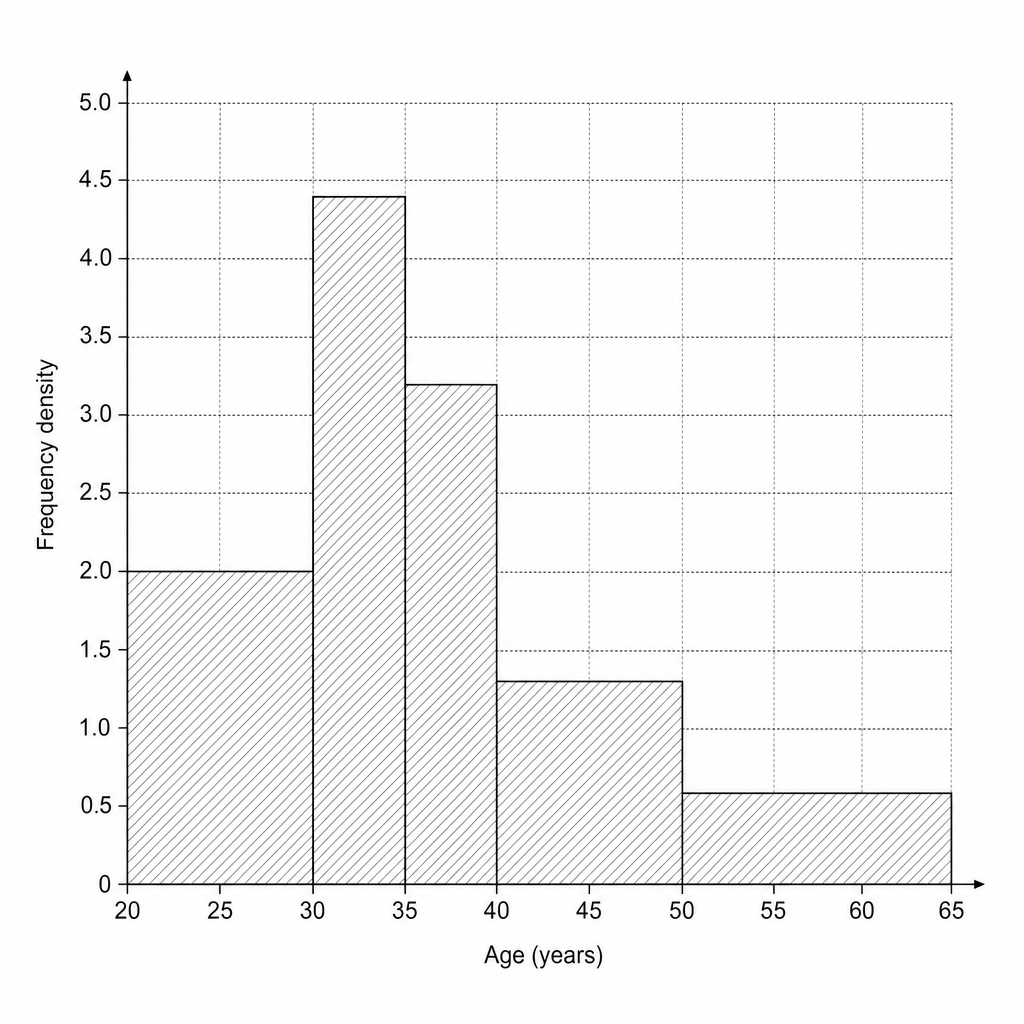
The table shows information about the age of 80 teachers.
| Age (years) | Frequency |
|---|---|
| 20<a≤3020 < a \leq 3020<a≤30 | 20 |
| 30<a≤3530 < a \leq 3530<a≤35 | 22 |
| 35<a≤4035 < a \leq 4035<a≤40 | 16 |
| 40<a≤5040 < a \leq 5040<a≤50 | 13 |
| 50<a≤6550 < a \leq 6550<a≤65 | 9 |
On the grid, draw a histogram for the information in the table.
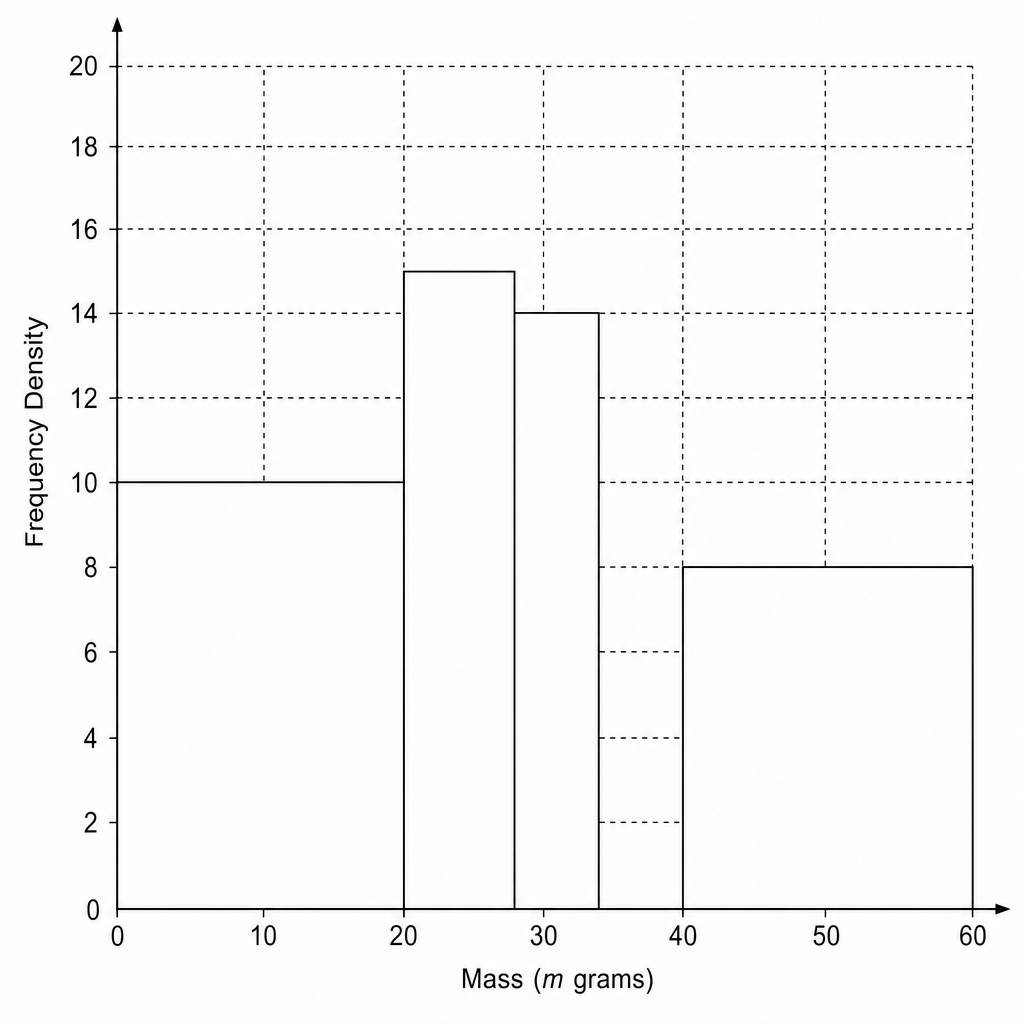
The table shows information about the mass, in grams, of some parcels.
| Mass (m m\,m g) | Frequency |
|---|---|
| 0<m≤200 < m \leq 200<m≤20 | 10 |
| 20<m≤3020 < m \leq 3020<m≤30 | 15 |
| 30<m≤3530 < m \leq 3530<m≤35 | 14 |
| 35<m≤4035 < m \leq 4035<m≤40 | |
| 40<m≤6040 < m \leq 6040<m≤60 | 8 |
Use the information on the table to complete the histogram.
Use the histogram to complete the table.
The histogram shows information about the mass of several parcels in a delivery van.
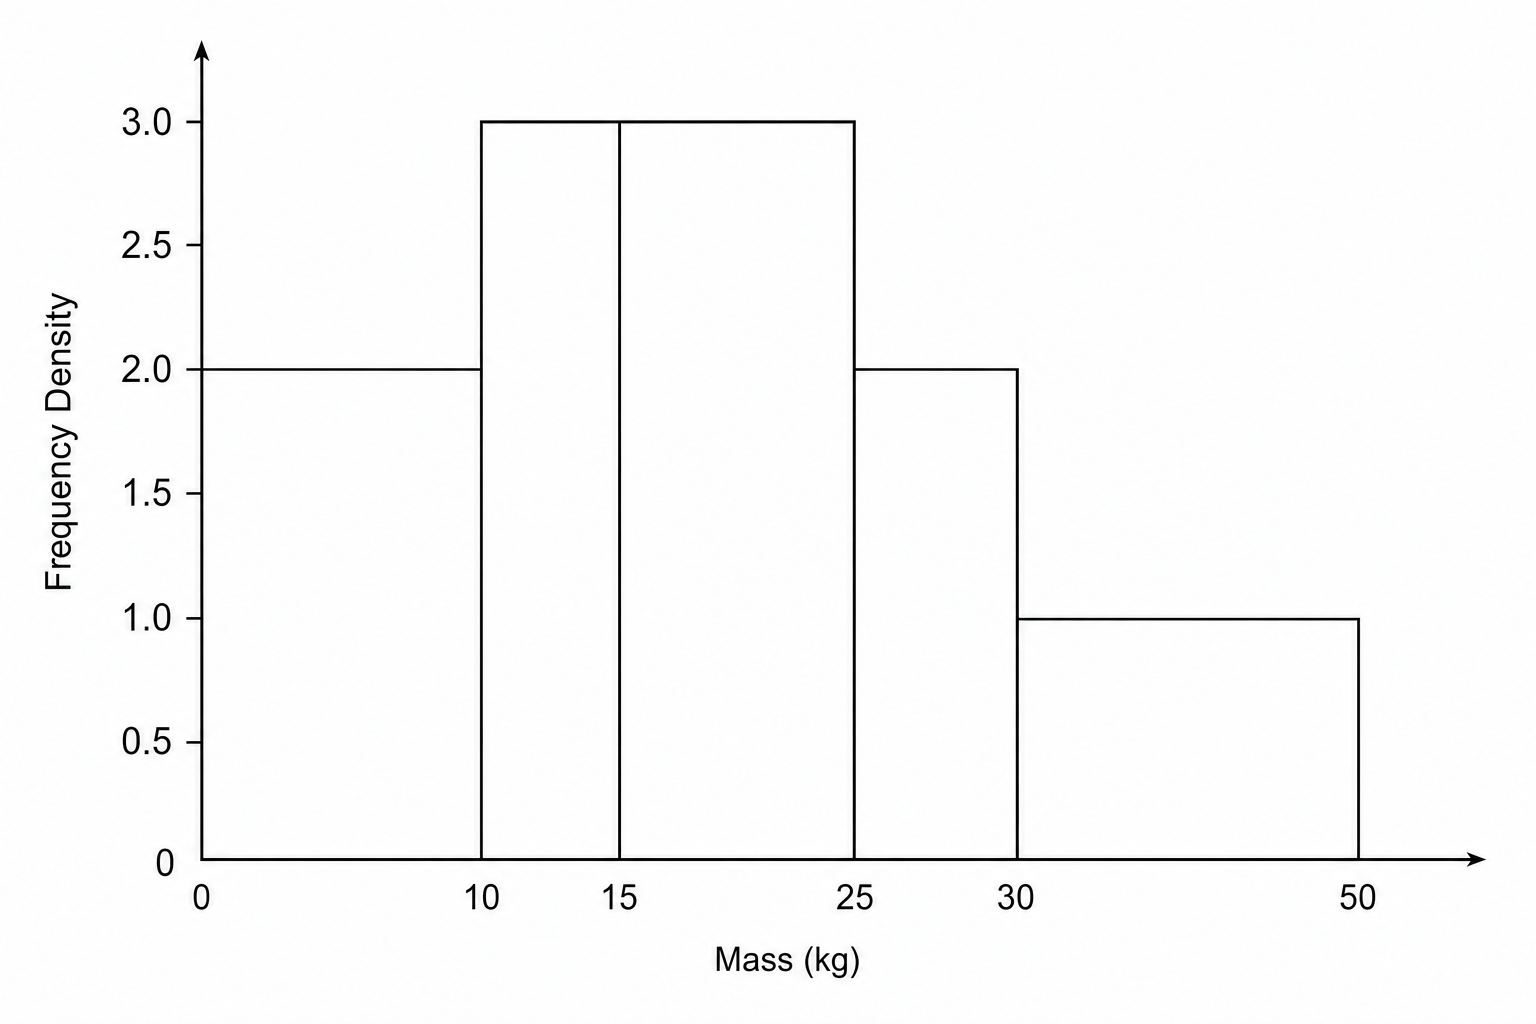
Work out an estimate for the proportion of parcels with a mass over 27.5kg.
Explain why your answer to part a is only an estimate.
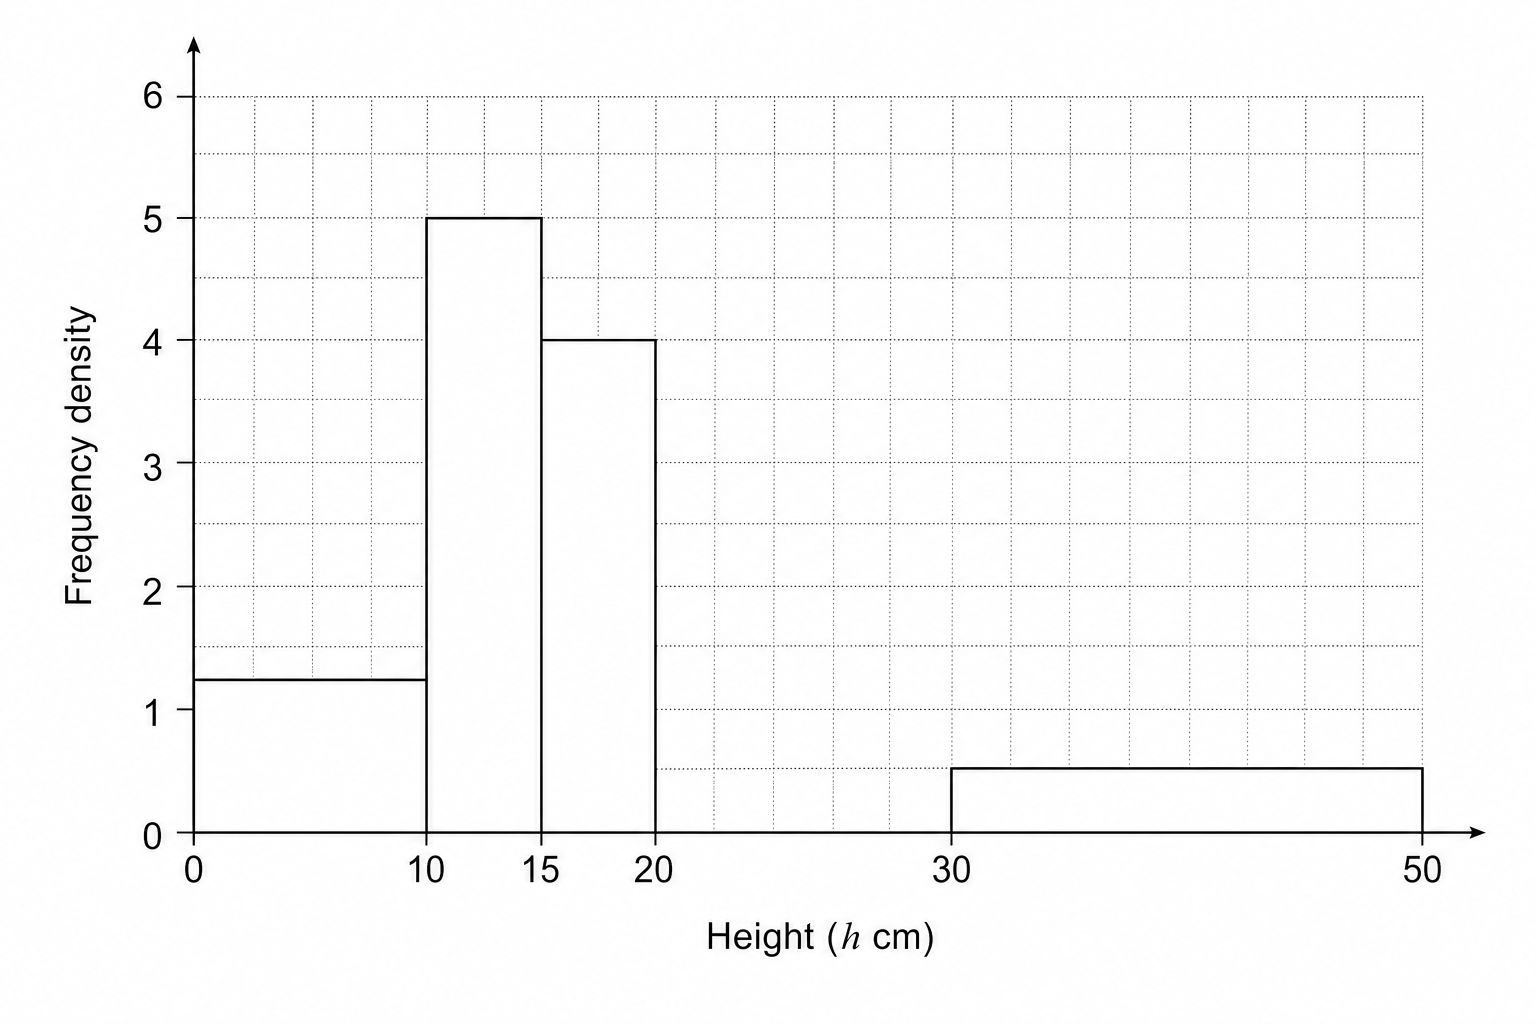
The table shows information about the height, in cm, of some plants in a greenhouse.
| Height (h h\,h cm) | Frequency |
|---|---|
| 0<h≤100 < h \leq 100<h≤10 | 15 |
| 10<h≤1510 < h \leq 1510<h≤15 | 25 |
| 15<h≤2015 < h \leq 2015<h≤20 | 20 |
| 20<h≤3020 < h \leq 3020<h≤30 | |
| 30<h≤5030 < h \leq 5030<h≤50 | 10 |
Use the information in the table to complete the histogram.
Use the histogram to complete the table.
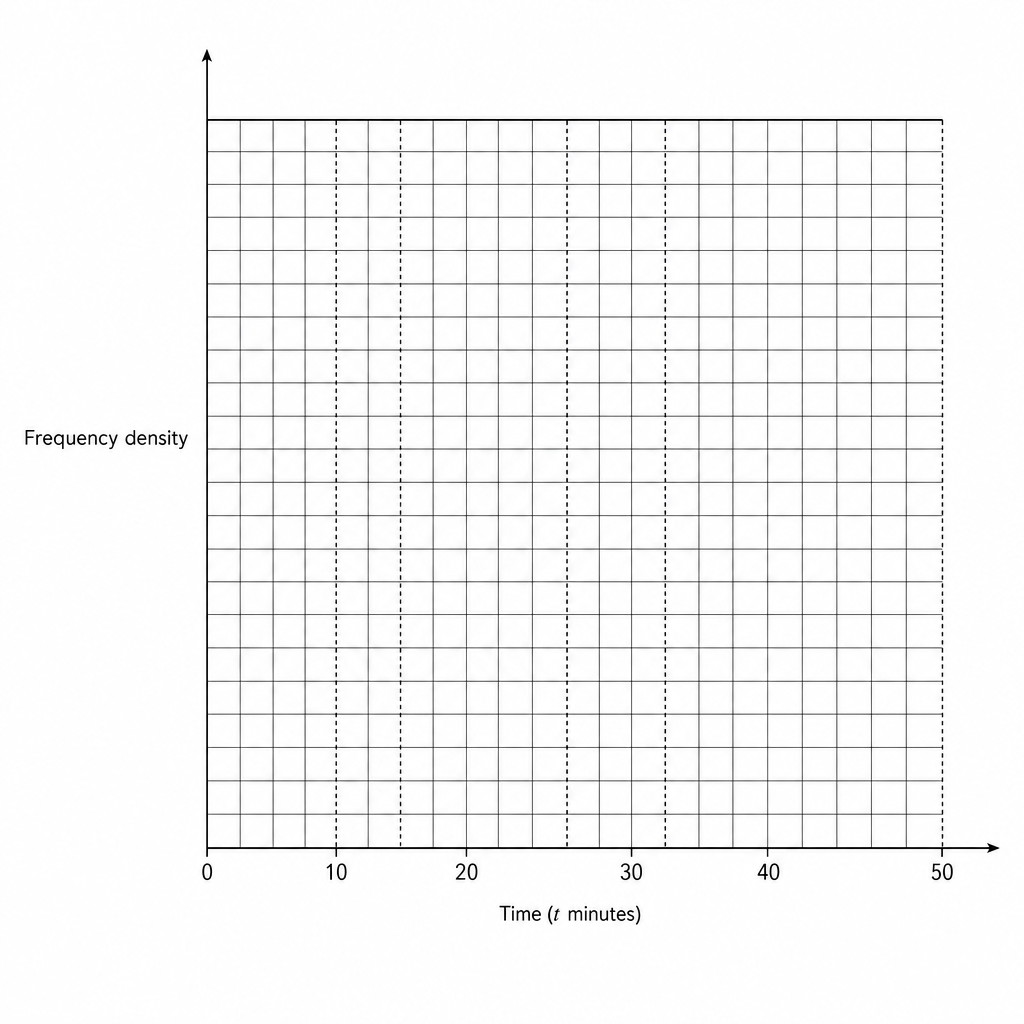
The table shows information about the time, in minutes, taken by 71 students to complete a puzzle.
| Time (t t\,t minutes) | Frequency |
|---|---|
| 0<t≤100 < t \leq 100<t≤10 | 12 |
| 10<t≤1510 < t \leq 1510<t≤15 | 15 |
| 15<t≤2515 < t \leq 2515<t≤25 | 20 |
| 25<t≤3025 < t \leq 3025<t≤30 | 14 |
| 30<t≤5030 < t \leq 5030<t≤50 | 10 |
On the grid, draw a histogram for the information in the table.
The table shows information about the masses, in kg, of some packages.
| Mass (m m\,m kg) | Frequency |
|---|---|
| 0<m≤100 < m \leq 100<m≤10 | 10 |
| 10<m≤1510 < m \leq 1510<m≤15 | 15 |
| 15<m≤2515 < m \leq 2515<m≤25 | 40 |
| 25<m≤3025 < m \leq 3025<m≤30 | 15 |
| 30<m≤5030 < m \leq 5030<m≤50 | 10 |
On the grid, draw a histogram for the information in the table.
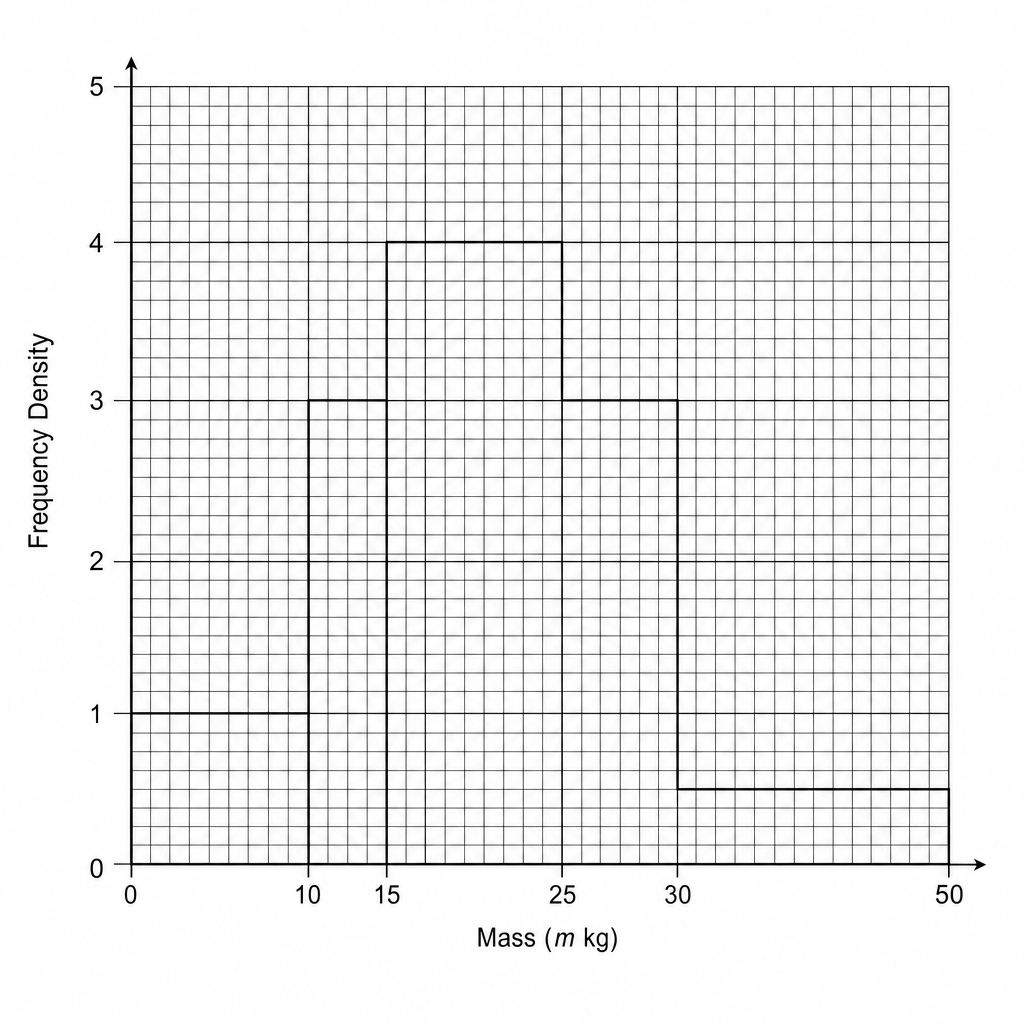
Work out an estimate for the number of packages with a mass over 28 kg.
The table shows information about the height of 90 young trees.
| Height (h h\,h cm) | Frequency |
|---|---|
| 0<h≤100 < h \leq 100<h≤10 | 15 |
| 10<h≤1510 < h \leq 1510<h≤15 | 20 |
| 15<h≤2515 < h \leq 2515<h≤25 | 40 |
| 25<h≤4025 < h \leq 4025<h≤40 | 15 |
On the grid, draw a histogram for the information in the table.
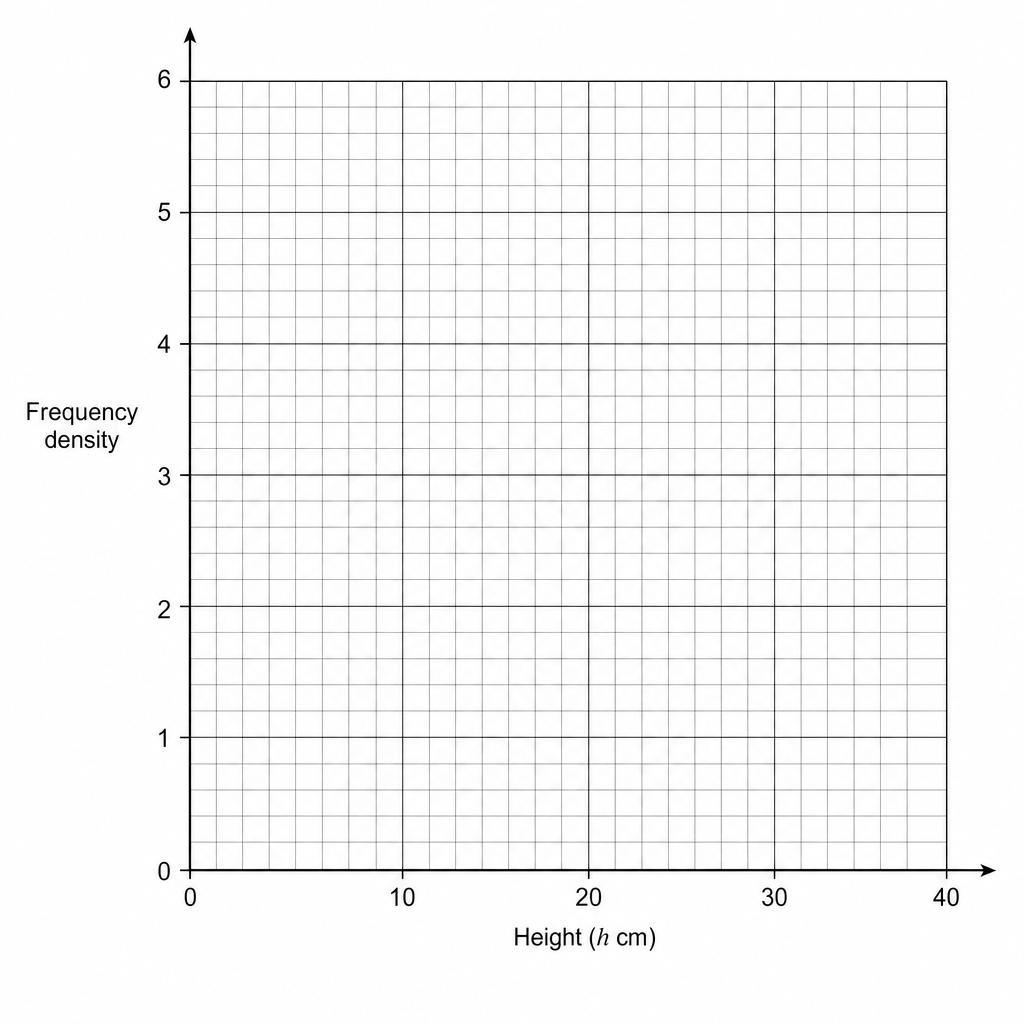
Find an estimate for the median.
The histogram shows information about the speed of cars passing a checkpoint.
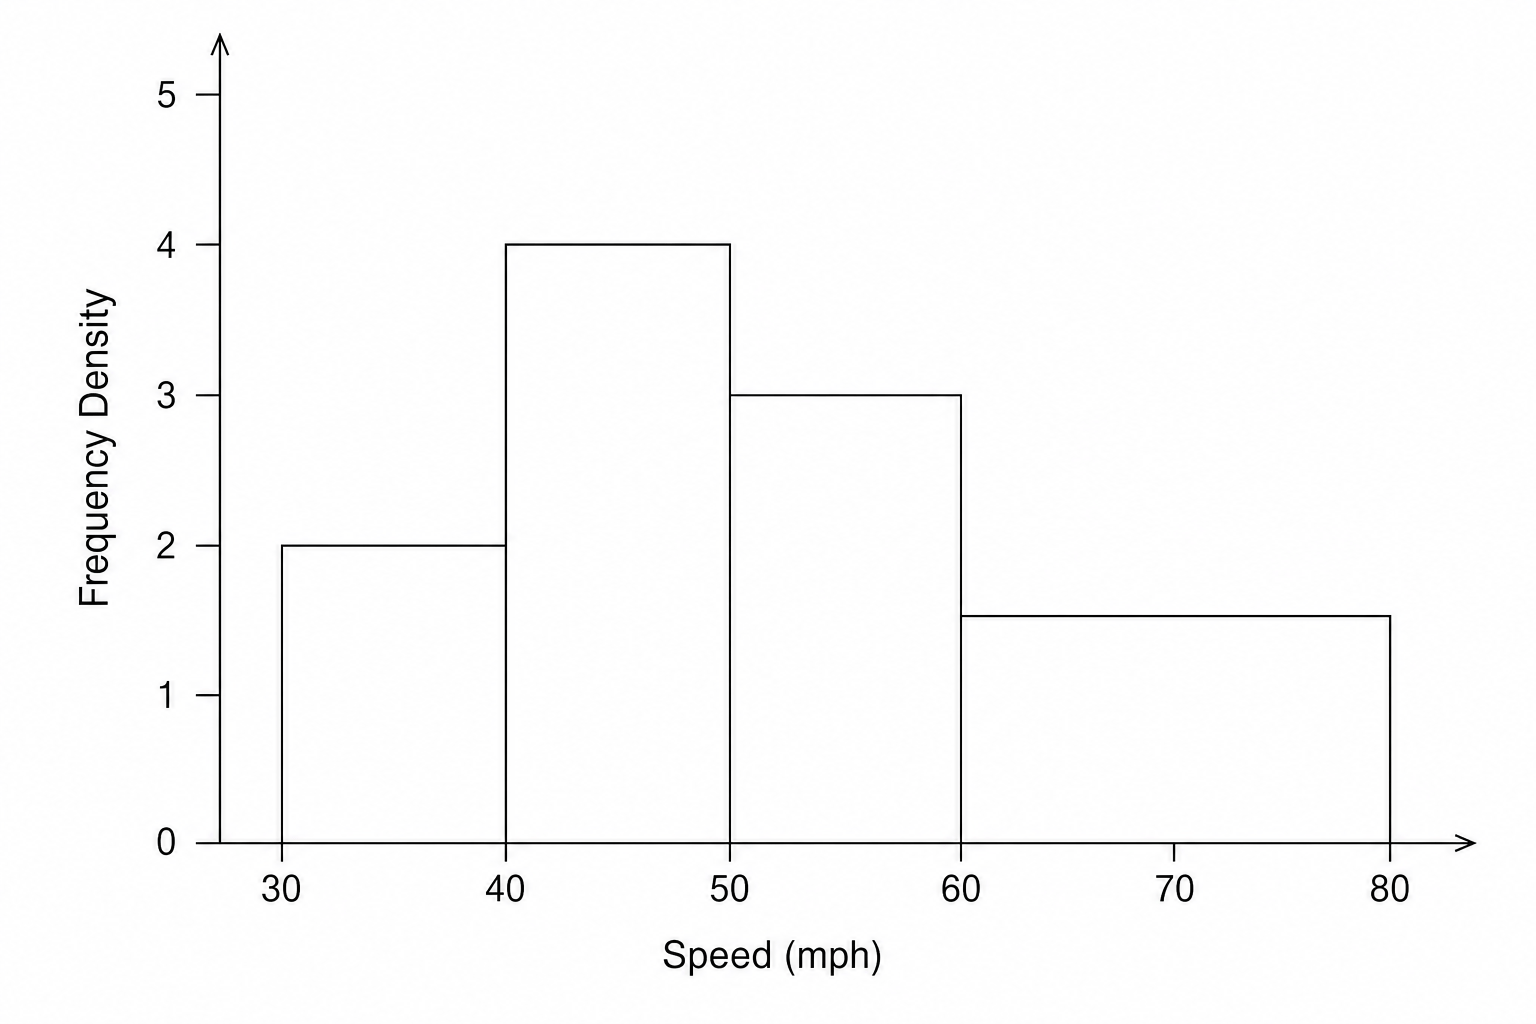
40 cars have a speed between 40 and 50 mph.
Work out an estimate for the number of cars which have a speed of more than 65 mph.
Explain why your answer to part a is only an estimate.
The table shows information about the speed, in mph, of some cars.
| Speed (mph) | Frequency |
|---|---|
| 40<s≤5540 < s \leq 5540<s≤55 | 6 |
| 55<s≤6055 < s \leq 6055<s≤60 | 10 |
| 60<s≤6560 < s \leq 6560<s≤65 | 46 |
| 65<s≤7565 < s \leq 7565<s≤75 | 48 |
| 75<s≤9075 < s \leq 9075<s≤90 | 6 |
On the grid, draw a histogram for the information in the table.
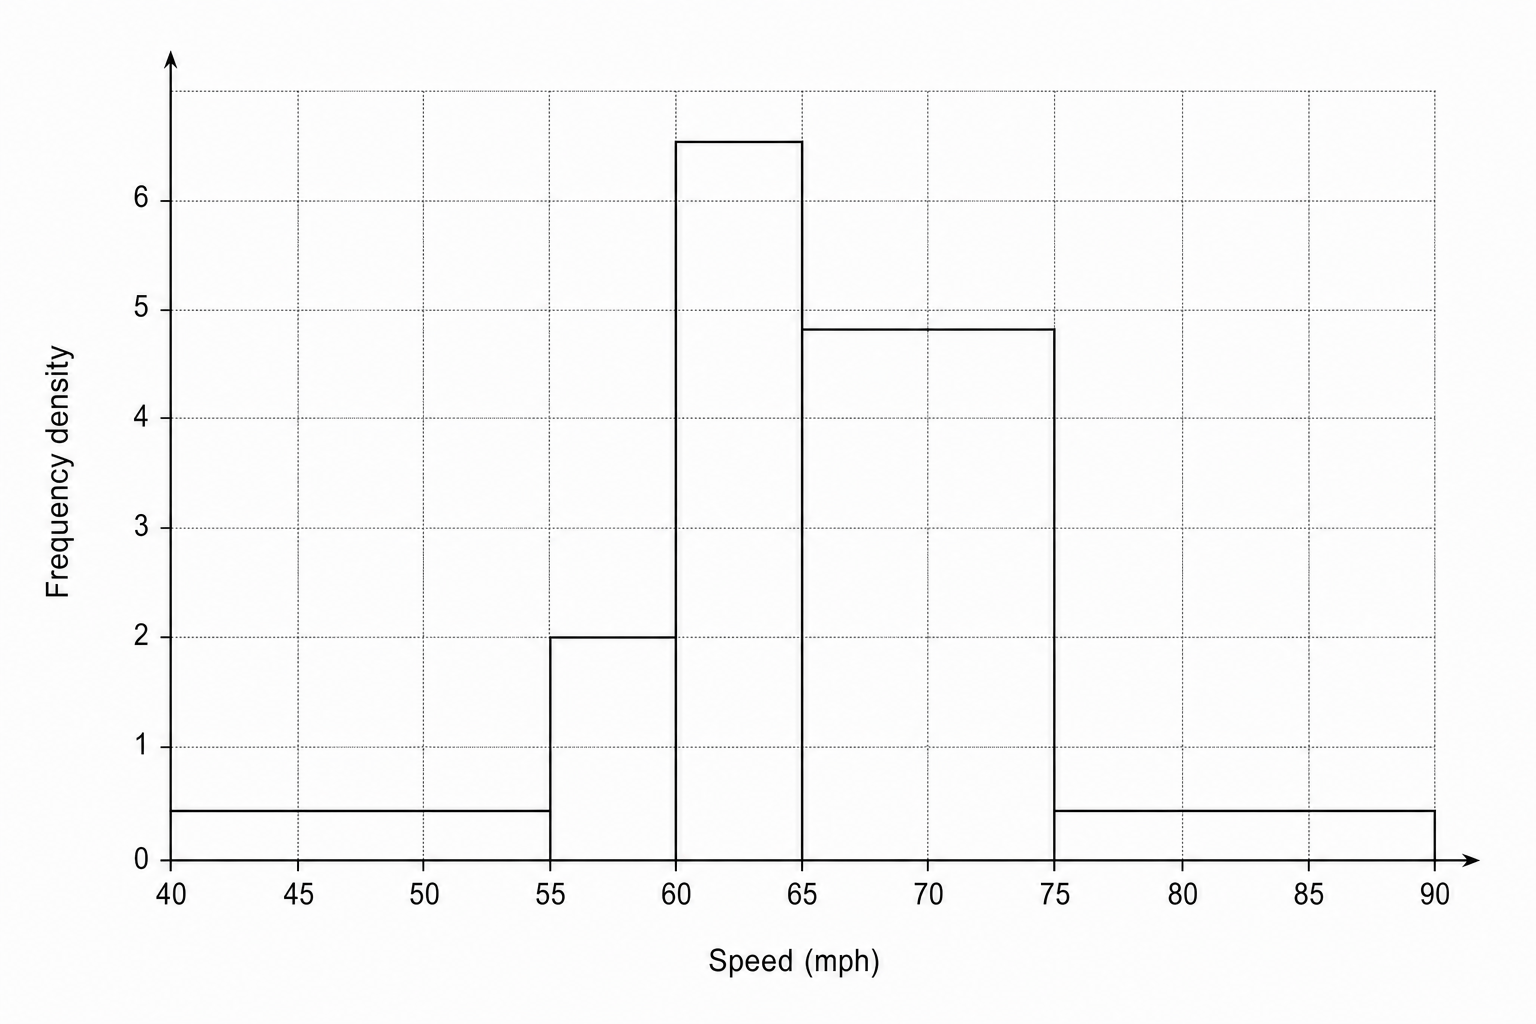
Work out an estimate for the number of cars over 70mph.
The histogram shows information about the time taken by members of a running club to complete a 10km race.
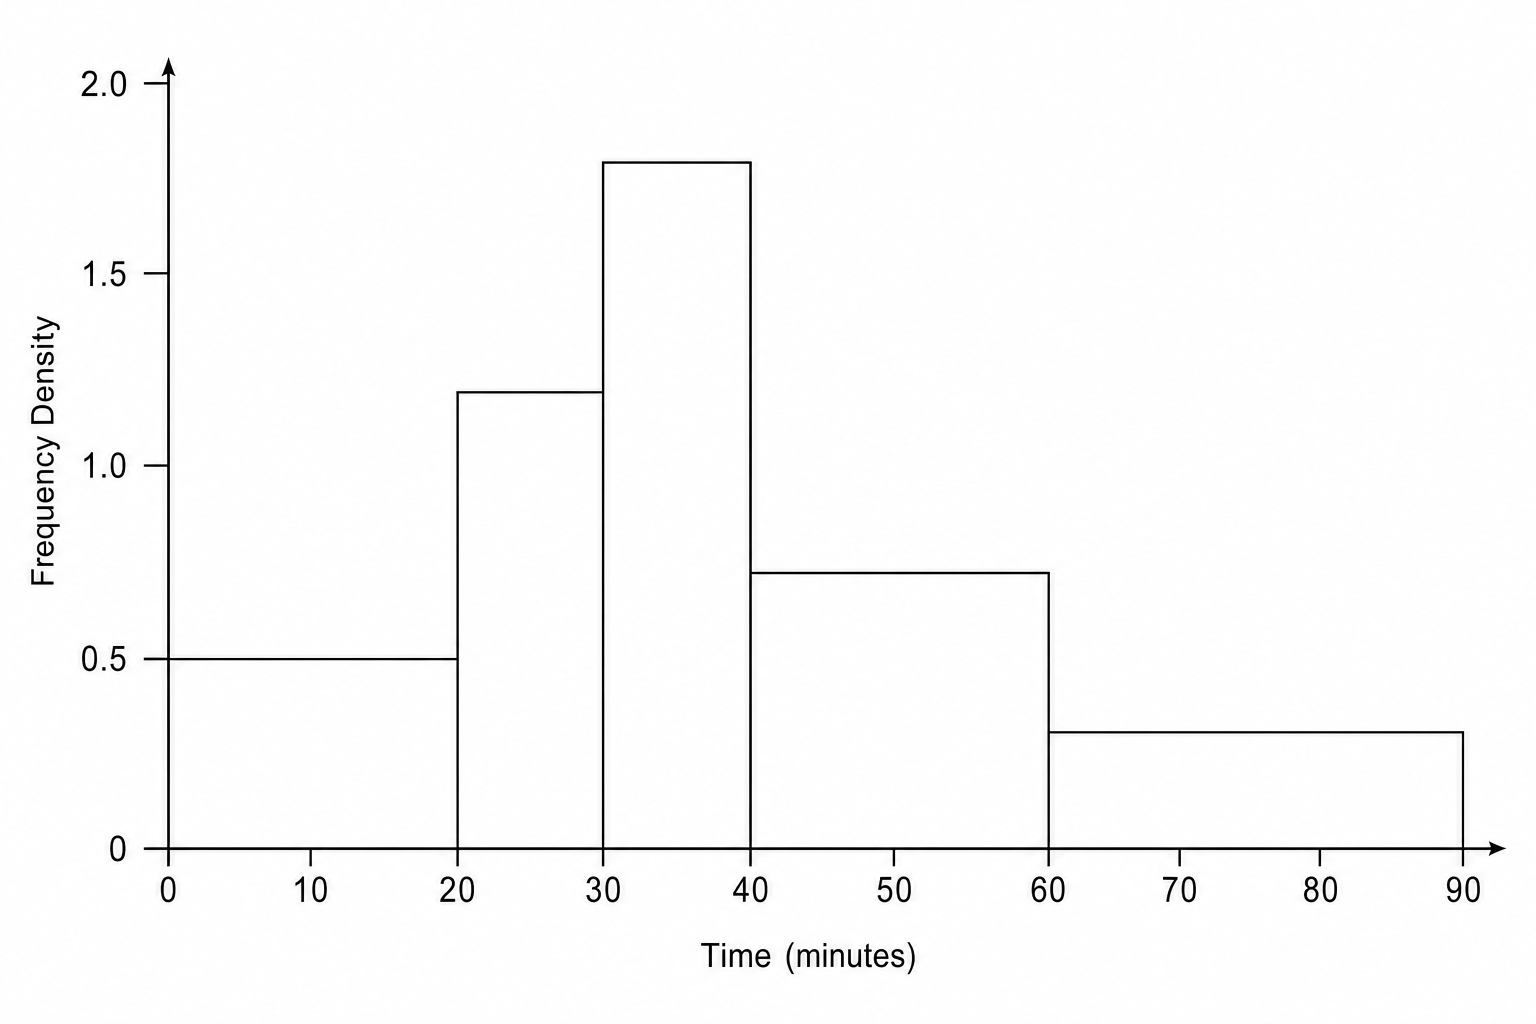
Work out an estimate for the proportion of runners who took longer than 50 minutes.
Explain why your answer to part a is only an estimate.
Histograms Questions
Practise AQA GCSE Maths Histograms with exam-style questions for Foundation and Higher tier. 28 questions, matched to the AQA GCSE Maths (8300) specification and written in Paper 1, Paper 2 and Paper 3 style. Every question includes a full worked solution and mark scheme, so you can see where marks are awarded rather than just whether you got the answer right.