Question 2
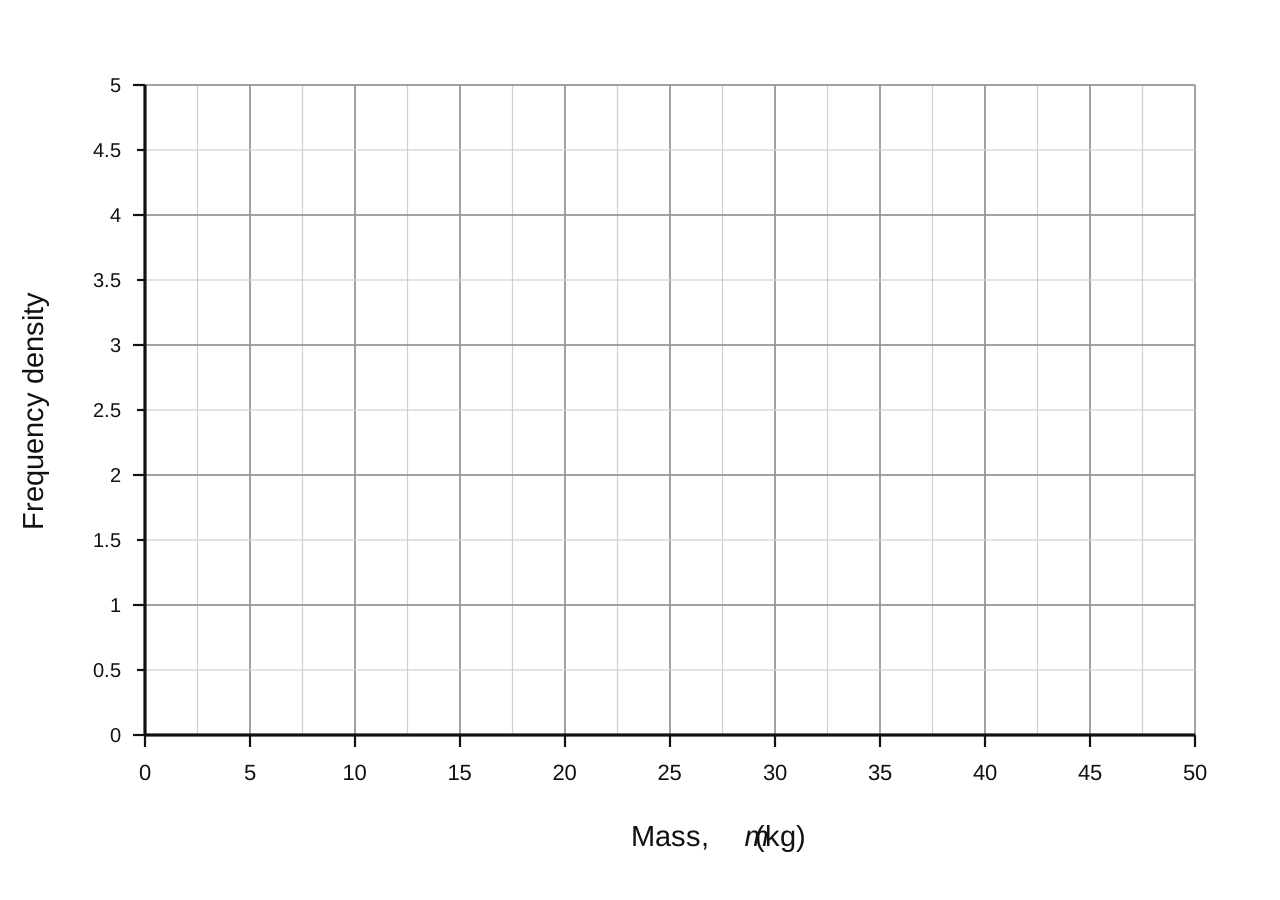
The table shows information about the masses, in kg, of some packages.
| Mass (m m\,m kg) | Frequency |
|---|---|
| 0<m≤100 < m \leq 100<m≤10 | 10 |
| 10<m≤1510 < m \leq 1510<m≤15 | 15 |
| 15<m≤2515 < m \leq 2515<m≤25 | 40 |
| 25<m≤3025 < m \leq 3025<m≤30 | 15 |
| 30<m≤5030 < m \leq 5030<m≤50 | 10 |
a.[3]
On the grid, draw a histogram for the information in the table.
b.[1]
Work out an estimate for the number of packages with a mass over 28 kg.
Histograms Questions
23 exam-style questions on AQA GCSE Maths Histograms. Each one has a worked solution and a mark scheme showing where the marks go.