Question 9
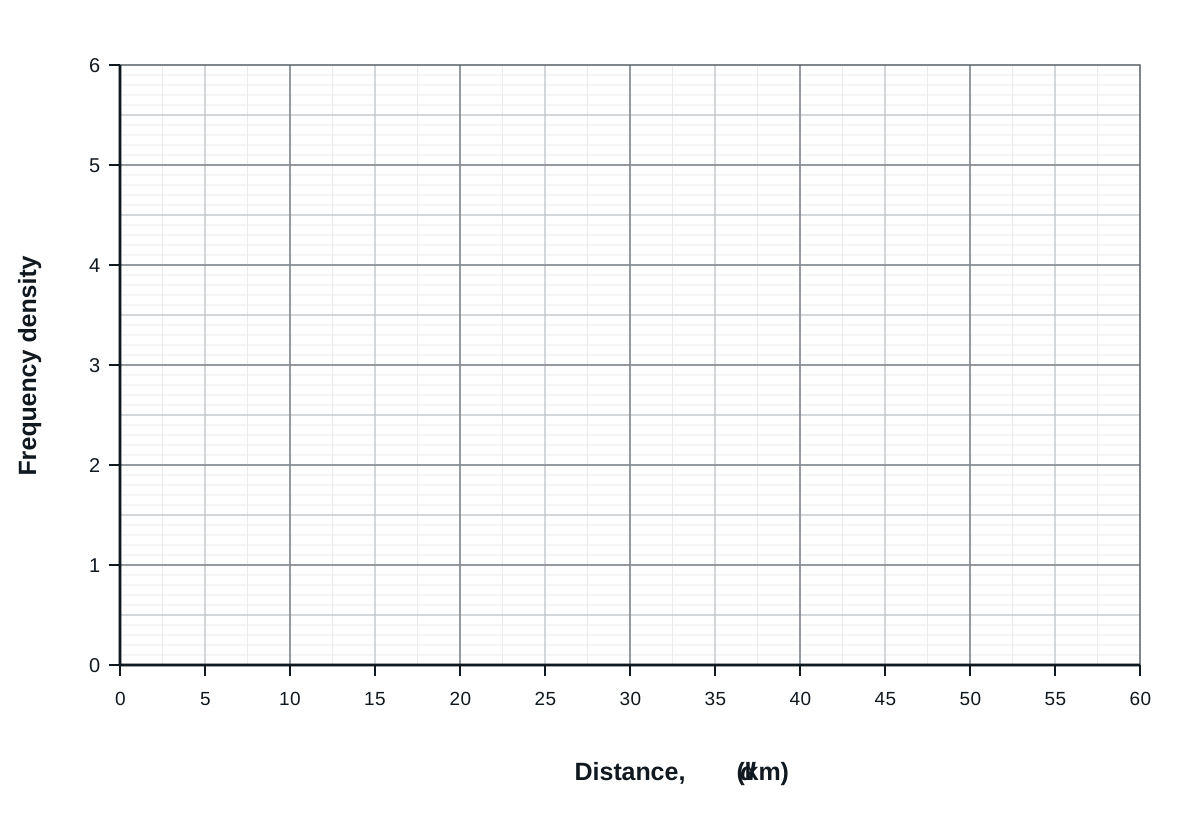
The table shows information about the distance, in km, that 95 employees travel to work.
| Distance (d d\,d km) | Frequency |
|---|---|
| 0<d≤50 < d \leq 50<d≤5 | 15 |
| 5<d≤105 < d \leq 105<d≤10 | 25 |
| 10<d≤2010 < d \leq 2010<d≤20 | 32 |
| 20<d≤4020 < d \leq 4020<d≤40 | 16 |
| 40<d≤6040 < d \leq 6040<d≤60 | 7 |
On the grid, draw a histogram for the information in the table.
Histograms Questions
23 exam-style questions on AQA GCSE Maths Histograms. Each one has a worked solution and a mark scheme showing where the marks go.