Question 1
52%The cumulative frequency graph shows the mass, in grams, of 80 apples.
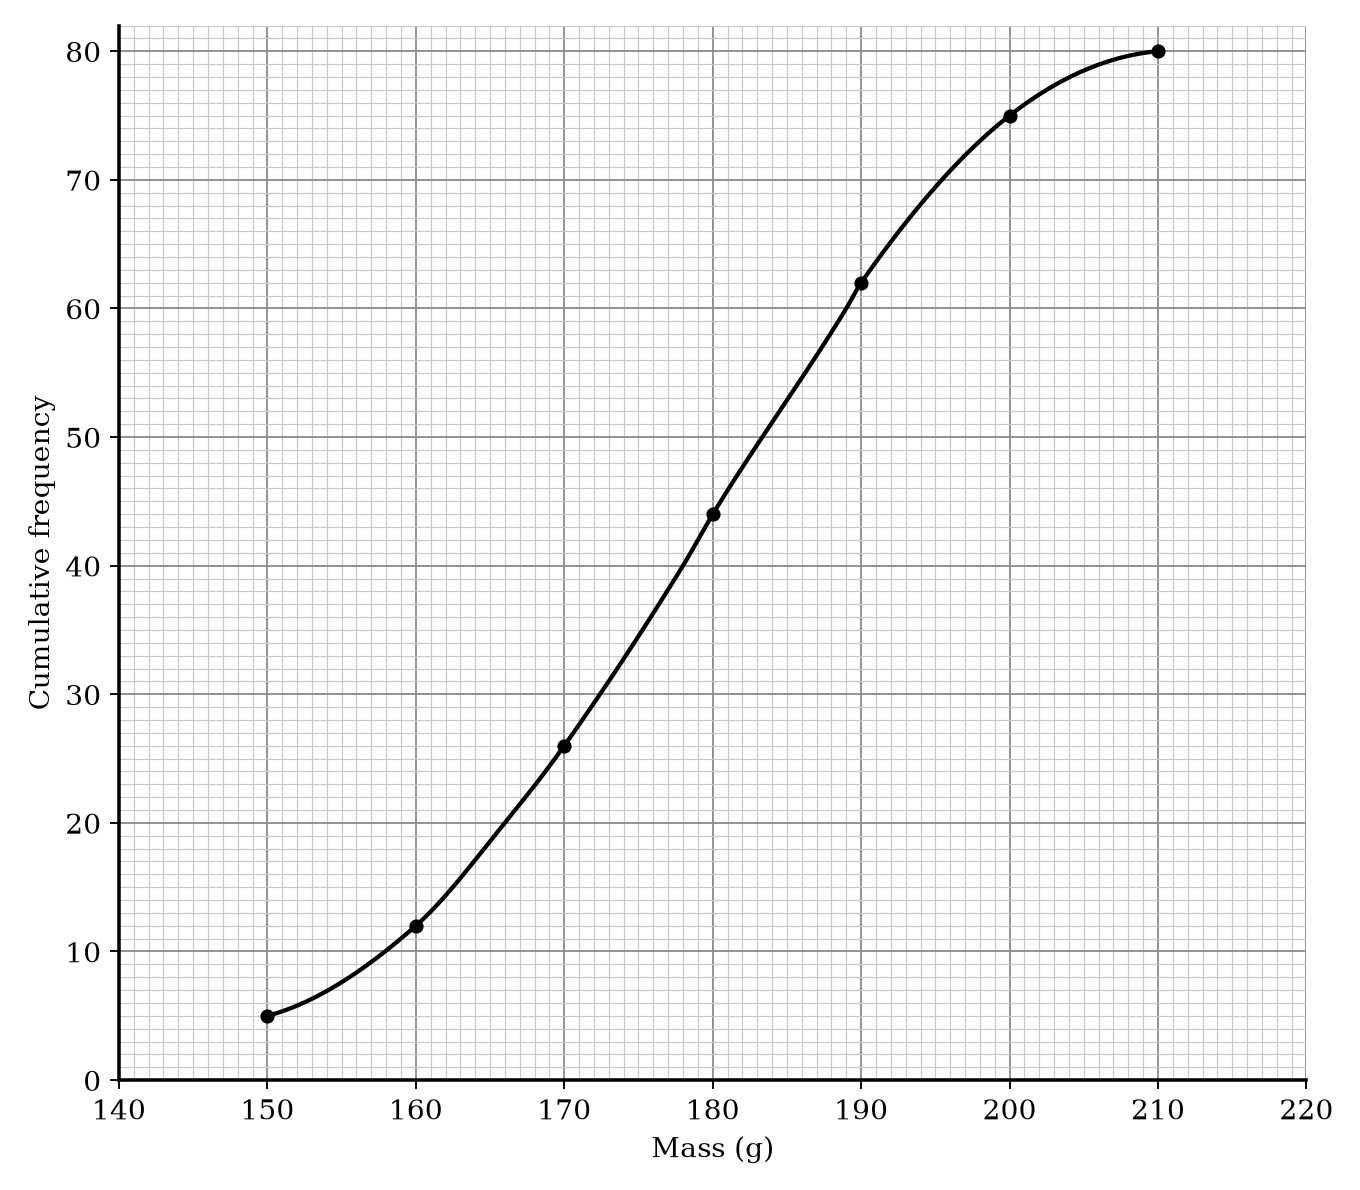
| Mass (ggg) | Cumulative frequency |
|---|---|
| 150 | 5 |
| 160 | 12 |
| 170 | 26 |
| 180 | 44 |
| 190 | 62 |
| 200 | 75 |
| 210 | 80 |
The 80 apples had a minimum mass of 145 grams and a maximum mass of 208 grams.
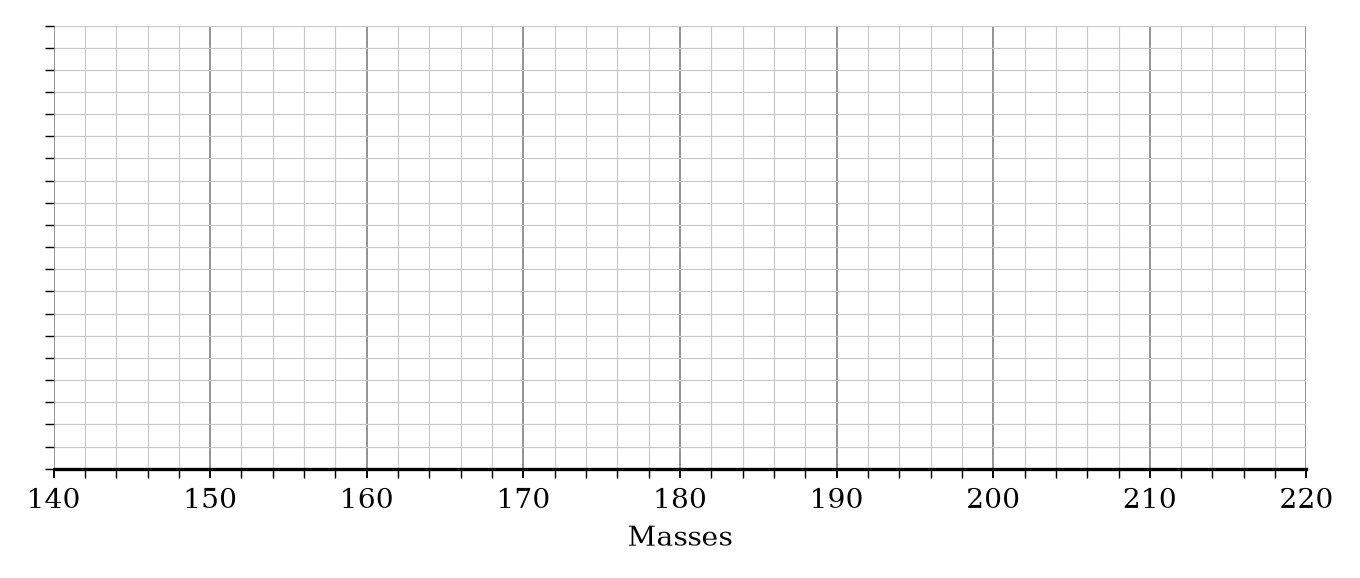
Draw a box plot to show the distribution of the masses of the apples.
Box Plots Questions
27 exam-style questions on AQA GCSE Maths Box Plots. Each one has a worked solution and a mark scheme showing where the marks go.