What you'll learn
- How a geographical enquiry moves from a question to a conclusion.
- How to collect fieldwork data using observation, measurement and sampling.
- How to process and present fieldwork data using maps, graphs and diagrams.
- How to analyse, conclude and evaluate like a geographer in the exam.
What fieldwork means
Fieldwork is Geography done in the real world. Instead of only learning about rivers, coasts, cities or people from a textbook, you collect evidence in an actual place and use it to answer a geographical question.
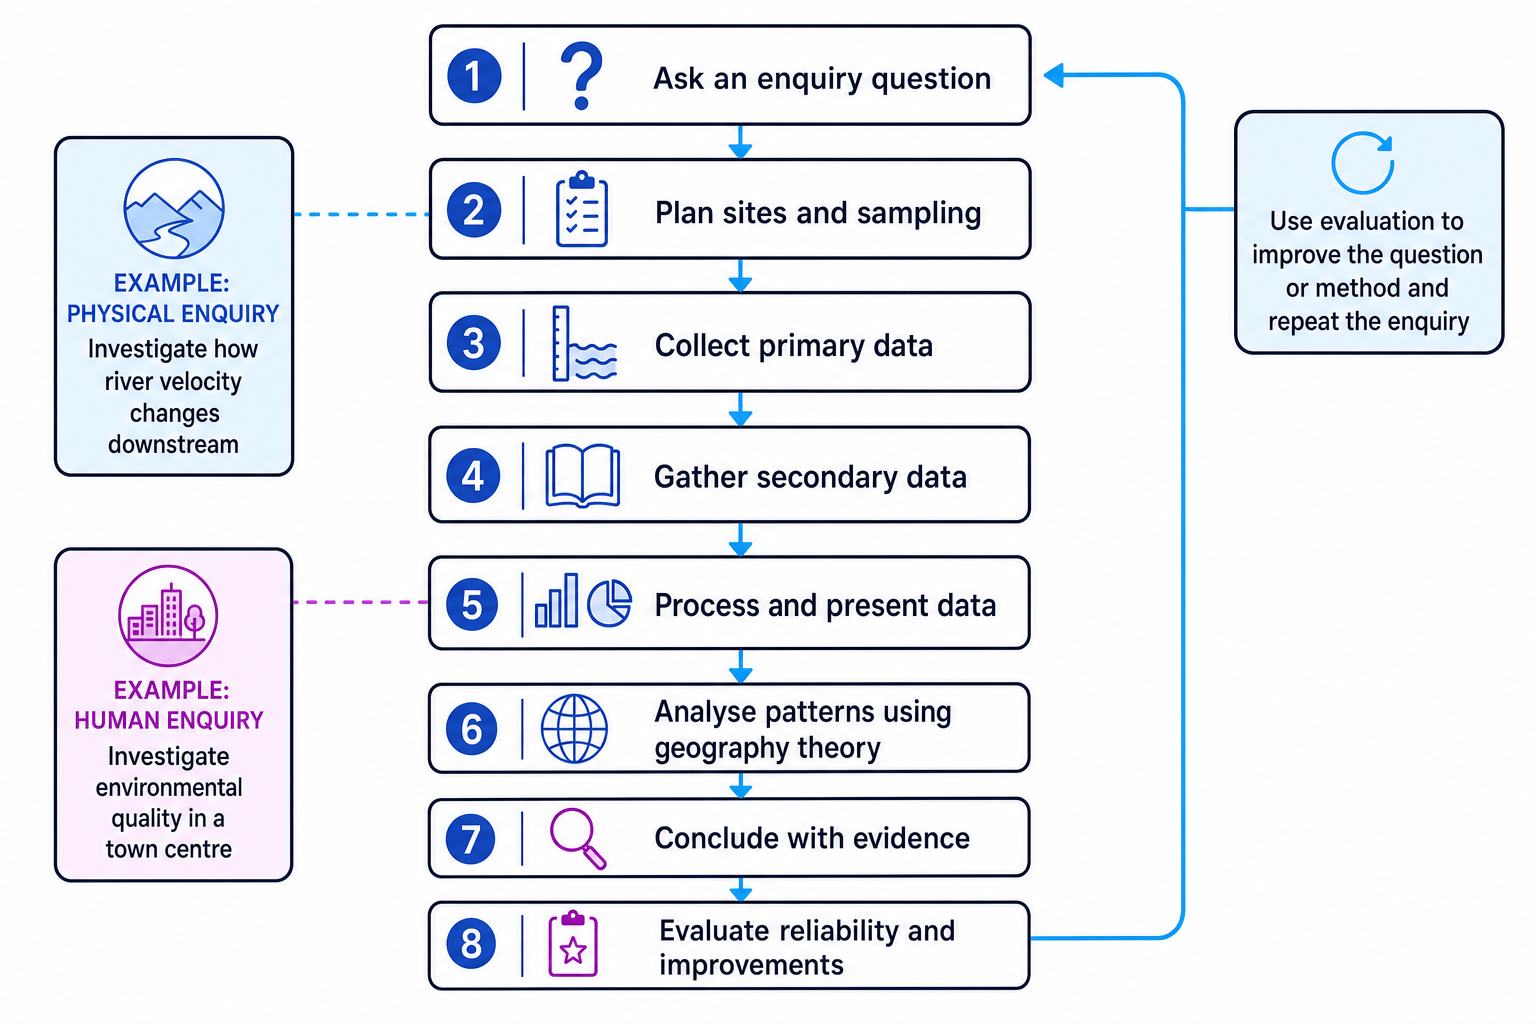
For GCSE Geography, your fieldwork must happen outside the classroom and beyond the school grounds, on at least two occasions, in contrasting locations, and must include both a physical geography context and a human geography context. For example, a physical enquiry might study a river such as the River Holford in Somerset, while a human enquiry might investigate environmental quality in a town centre such as Stratford in East London. Your own school may use different places.
Geographical fieldwork
Geographical fieldwork is the process of applying geographical knowledge, understanding and skills in a real out-of-classroom place to investigate a question using evidence.
The fieldwork enquiry process
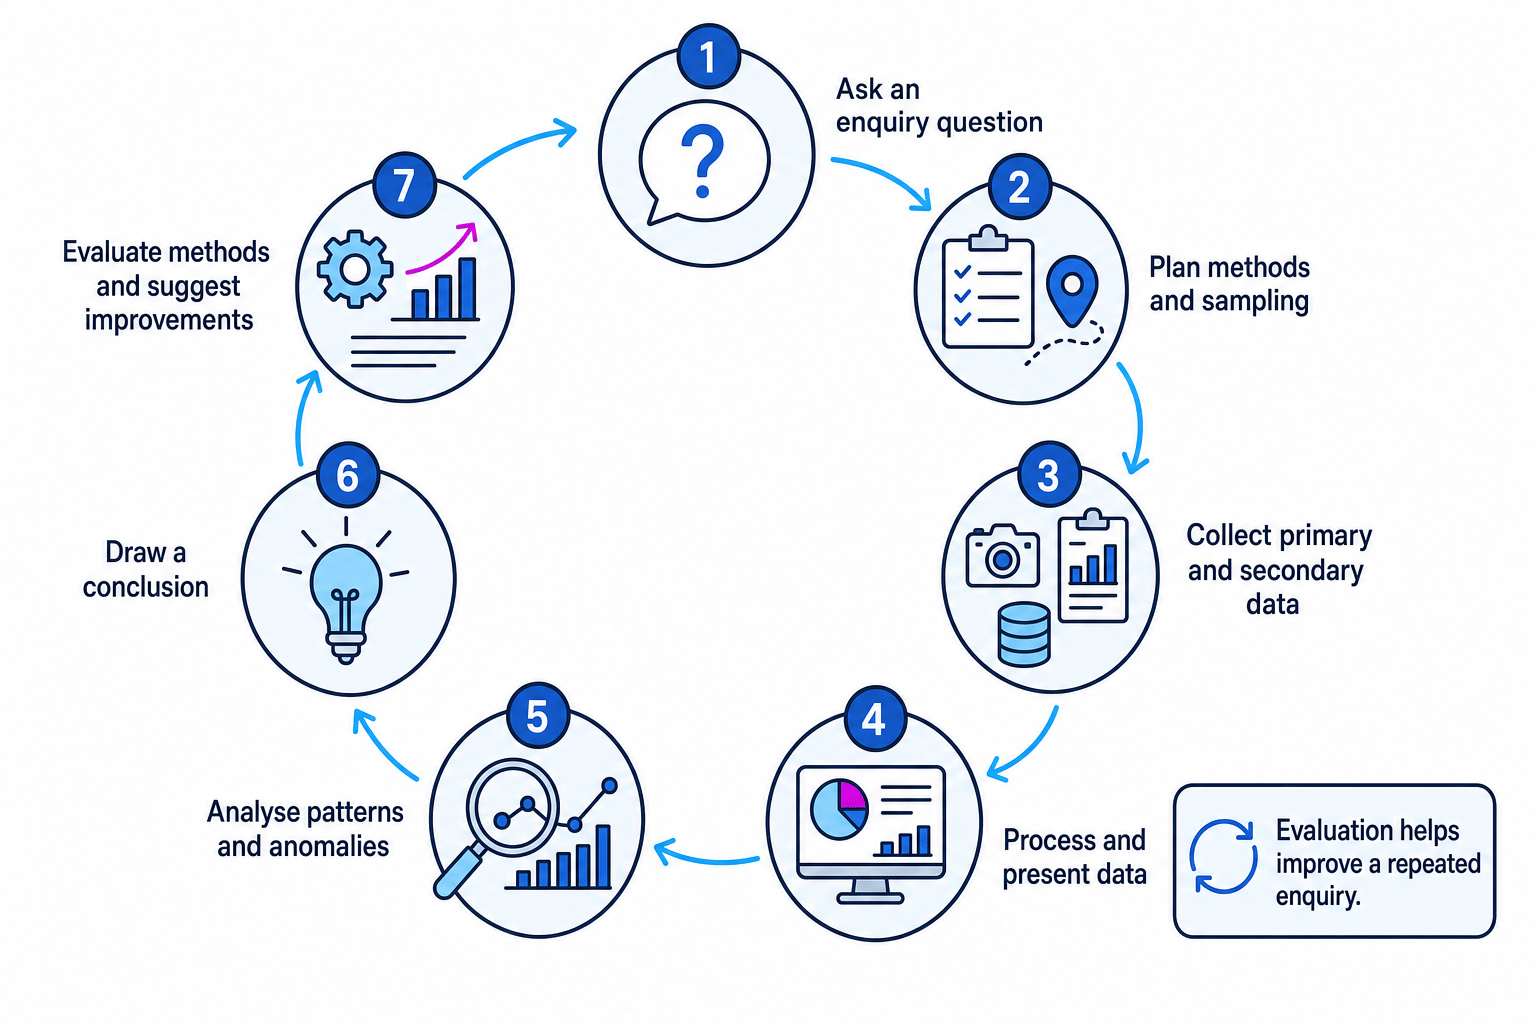
A fieldwork enquiry is not just “going somewhere and collecting data”. It is a sequence of decisions: you ask a question, choose methods, collect evidence, process it, analyse it, conclude, and evaluate how good your enquiry was.
The whole process is a cycle, because evaluation helps you improve the enquiry if it were repeated.
Fieldwork is evidence-led
Your conclusion should come from the data you collected, not from what you hoped or expected to find.
Asking a good enquiry question
An enquiry question is the main question your fieldwork is trying to answer. A good one is:
- specific: it names a place, process or group.
- measurable: you can collect data to answer it.
- geographical: it links to patterns, processes, places or people.
- manageable: it can be investigated safely in the time available.
Weak questions are often too vague, such as “Is the town centre good?” Better questions focus on a measurable pattern, such as “How does environmental quality change with distance from the main shopping street?”
Improving an enquiry question
A class wants to investigate a town centre.
- Replace the vague word “good” with a measurable idea, such as environmental quality, which could include noise, litter, traffic, greenery and building condition.
- Add a spatial pattern to investigate, such as distance from the main shopping street or change along a transect.
- Link it to geographical explanation: for example, land use, pedestrianisation, traffic management or recent regeneration.
- A stronger question becomes: “How and why does environmental quality vary with distance from the main shopping street in Stratford, East London?”
Planning data collection
Before collecting data, you need to decide what evidence will answer the enquiry question.
Primary and secondary data
Primary data is collected first-hand by you in the field, such as river depth measurements or pedestrian counts. Secondary data has already been collected by someone else, such as census data, weather records, OS maps or local council reports.
Data can also be quantitative or qualitative. Quantitative data uses numbers, such as beach width in metres or traffic count per minute. Qualitative data uses descriptions, opinions or judgements, such as interview responses or field sketches.
Observation and measurement
Observation means carefully looking, listening and recording what is happening. Examples include land-use mapping, field sketches and environmental quality surveys.
Measurement means collecting numerical data using equipment or a consistent method. Examples include:
- river width, depth and velocity.
- beach gradient and sediment size.
- pedestrian counts and traffic counts.
- questionnaire results converted into categories or totals.
Keep methods consistent
Use the same method at every site. For example, if you count pedestrians for 5 minutes at one location, count for 5 minutes at all locations. This makes your data more comparable.
Sampling: choosing where or who to study
You usually cannot measure everything or ask everyone. Instead, you take a sample.
Sampling
Sampling is choosing a smaller number of people, sites or measurements from a larger population, which is the whole group or area you are interested in.
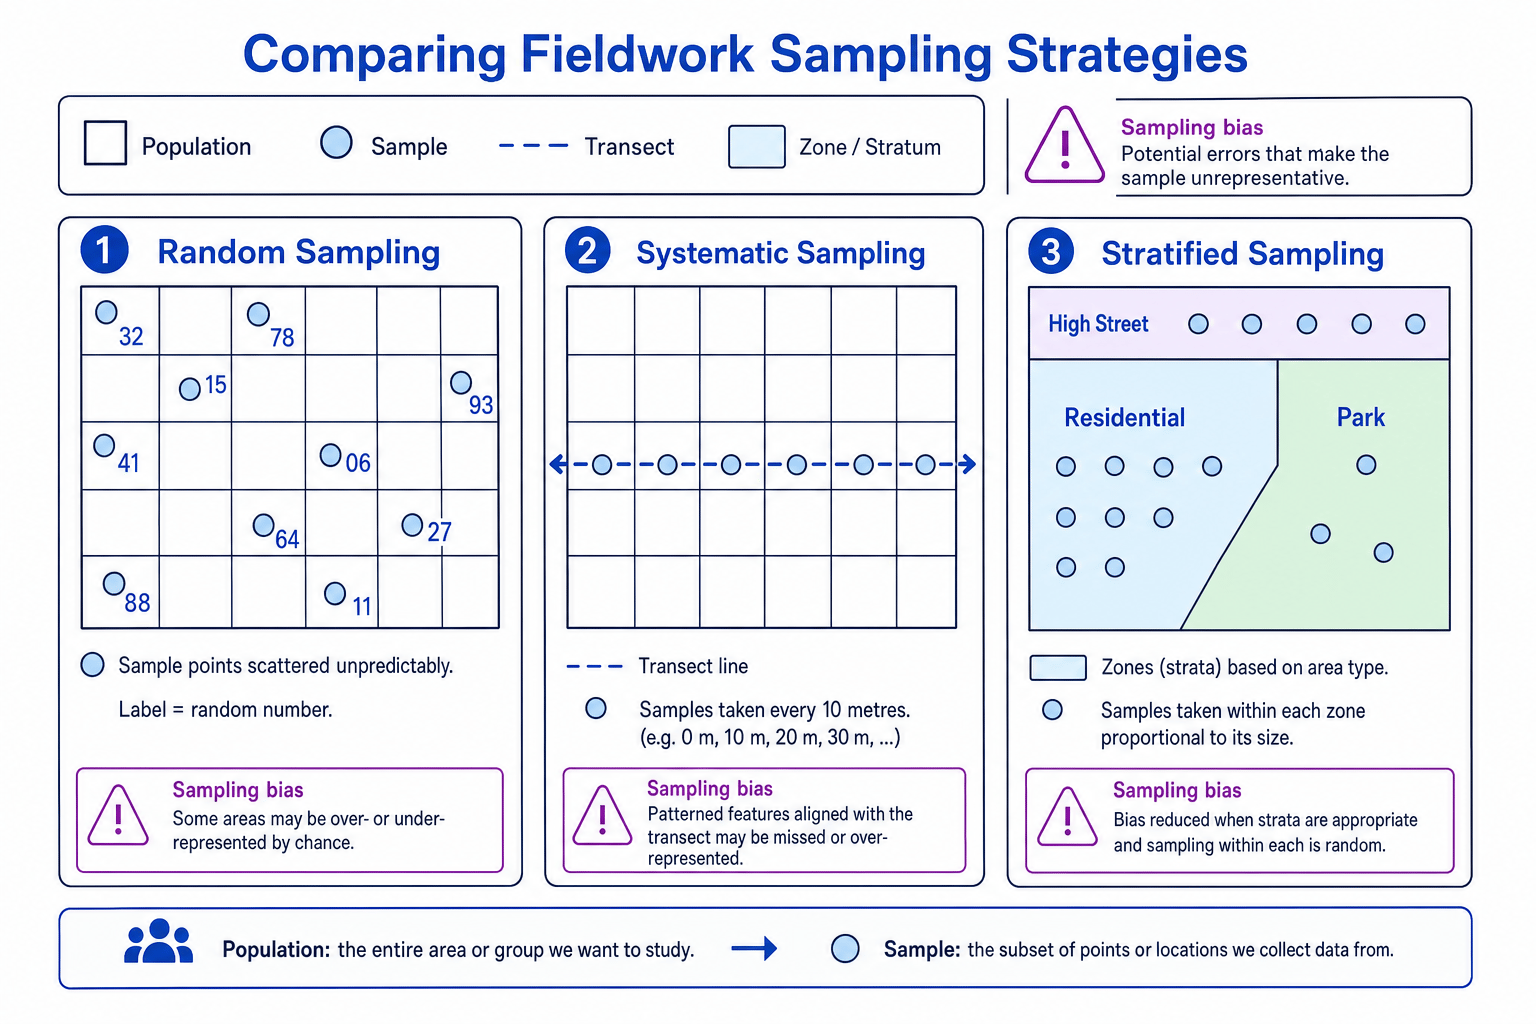
The diagram below compares common sampling strategies used in GCSE fieldwork.
Common sampling strategies
- Random sampling: sites or people are chosen by chance, often using random numbers.
- Systematic sampling: data is collected at regular intervals, such as every 10 metres along a beach transect.
- Stratified sampling: the sample includes different groups or zones in proportion to their importance or size, such as residential, retail and park areas.
- Opportunity sampling: you use people or sites that are easiest to access. This is quick, but it can be biased.
Convenient does not always mean representative
Opportunity sampling is easy, but if you only ask people standing near a bus stop, your results may not represent the whole town centre population.
Processing and presenting data
Raw data is the original data you collected. Processed data has been organised or calculated so patterns are easier to see.
You might process data by:
- calculating totals, means, medians, modes or ranges.
- converting results into percentages.
- grouping questionnaire answers into categories.
- coding interview transcripts into themes such as “traffic”, “safety” or “green space”.
Calculating mean, range and percentage change
A river group measured velocity three times at an upstream site and three times at a downstream site. Upstream readings were 0.32, 0.36 and 0.40 m/s. Downstream readings were 0.74, 0.78 and 0.82 m/s.
- Calculate the upstream mean: 0.32+0.36+0.403=0.36\frac{0.32 + 0.36 + 0.40}{3} = 0.3630.32+0.36+0.40=0.36 m/s.
- Calculate the downstream mean: 0.74+0.78+0.823=0.78\frac{0.74 + 0.78 + 0.82}{3} = 0.7830.74+0.78+0.82=0.78 m/s.
- Compare spread using the range: upstream range is 0.08 m/s, and downstream range is also 0.08 m/s, so the repeated readings are equally consistent.
- Calculate percentage increase from upstream to downstream: 0.78−0.360.36×100≈116.7%\frac{0.78 - 0.36}{0.36} \times 100 \approx 116.7\%0.360.78−0.36×100≈116.7%.
- This suggests velocity more than doubled downstream, which may support the Bradshaw model if other river data also fits.
Choosing the right presentation method
Different data needs different presentation methods:
- Use a bar chart for categories, such as land use types.
- Use a line graph for change over distance or time, such as river depth downstream.
- Use a scatter graph to test relationships, such as distance from the CBD and environmental quality score.
- Use a located bar chart or proportional symbol map when the location of the data matters.
- Use a transect diagram to show change along a line across a beach, river valley or town centre.
- Use annotated photographs or field sketches to show visual evidence.
Graph choice shortcut
If your enquiry asks “does one variable affect another?”, a scatter graph is often useful because it shows whether there is a positive, negative or weak relationship.
Analysing and explaining data
Analysis means describing and explaining what the data shows. You should look for:
- patterns: repeated trends in the data.
- anomalies: results that do not fit the pattern.
- relationships: links between two variables.
- spatial variation: how results change from place to place.
Explanation is where you use your geographical knowledge. For example, a river study might link results to erosion, friction and the Bradshaw model. An urban study might link environmental quality to land use, traffic, regeneration or planning decisions.
Analysing an environmental quality transect
A class completed an environmental quality survey from a busy main road towards a pedestrianised shopping area. Scores increased from -4 near the main road to +9 in the pedestrianised zone, but one side street scored only +1.
- Identify the main pattern: environmental quality generally improves away from the main road and towards the pedestrianised area.
- Use evidence: the score changed from -4 to +9, showing a clear improvement along the transect.
- Explain the pattern geographically: less traffic, more seating, cleaner pavements and improved public spaces may increase environmental quality.
- Deal with the anomaly: the side street score of +1 may be lower because of bins, service entrances or poorer building maintenance.
- Make the judgement cautious: the pattern is strong for this transect, but more transects would improve confidence.
Drawing conclusions from evidence
A conclusion is your final answer to the enquiry question. It should not just repeat results; it should make a judgement based on evidence.
A strong conclusion usually:
- directly answers the enquiry question.
- uses specific data, such as scores, counts or measurements.
- mentions whether the evidence supports the original hypothesis.
- refers to anomalies or limitations.
- links to geographical processes or theory.
You may also be asked to use transcripts, which are written records of interviews, questionnaires or conversations. Do not just quote one person and treat it as proof. Instead, look for themes across several responses and compare them with your numerical data.
Cherry-picking evidence
Do not choose only the data that supports your point. A good geographer considers the overall pattern and explains any results that do not fit.
Evaluating fieldwork
Evaluation means judging how good your enquiry was. This is not the same as saying whether you enjoyed it.
Useful evaluation words include:
- accuracy: how close measurements are to the true value.
- reliability: whether the method would give similar results if repeated.
- validity: whether the method actually measures what it claims to measure.
- representativeness: whether the sample reflects the wider area or population.
- bias: anything that unfairly influences the results.
Good evaluation links a weakness to its likely effect and then suggests a realistic improvement. For example, “Only collecting pedestrian counts at lunchtime may overestimate footfall, so repeating counts in the morning and afternoon would make the results more representative.”
Evaluate the method, not just the result
Strong evaluation explains how data quality affected the conclusion. The best improvements are specific, realistic and linked to the weakness.
In the exam
- Read the fieldwork context carefully: identify whether it is physical, human, or both, and work out the enquiry question.
- When asked about methods, name the method and explain why it helps answer the question.
- When using data, quote precise evidence from the figure, graph, map or transcript.
- For conclusions, make a clear judgement and support it with more than one piece of evidence.
- For evaluation, use words like reliability, validity, accuracy, bias and representativeness, then suggest a realistic improvement.
Check yourself
- What makes an enquiry question suitable for fieldwork?
- How are random, systematic and stratified sampling different?
- How would you turn fieldwork data into an evidenced conclusion?