Study Figure 1, which shows the percentage of water used by different sectors in three global regions.
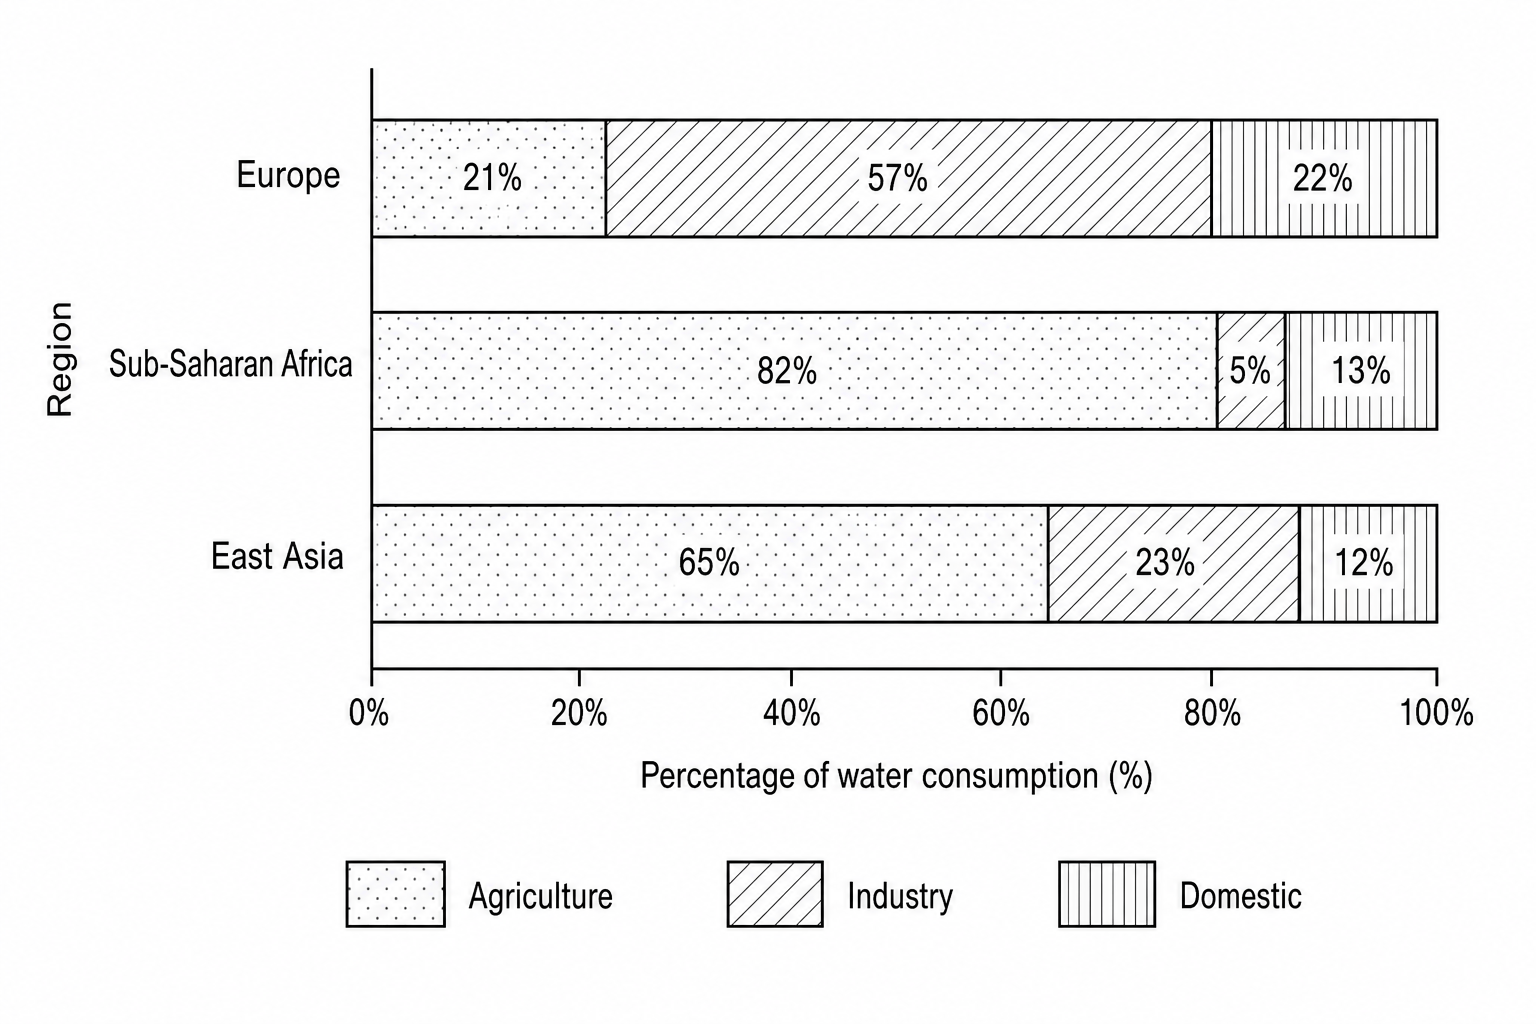
| Region | Agriculture (%) | Industry (%) | Domestic (%) |
|---|---|---|---|
| Europe | 21 | 57 | 22 |
| Sub-Saharan Africa | 82 | 5 | 13 |
| East Asia | 65 | 23 | 12 |
State two differences between the water use in Europe and Sub-Saharan Africa shown in Figure 1.

