Skip to content
MathsGenie logo
Open app

Course home

  1. GCSE
  2. Geography AQA
  3. Question bank

Water

EasyMediumHard
123456789101112131415161718192021222324252627282930
Question 24

The Challenge of Resource Management

Study Figures 1 and 2, which map water availability and water demand across Spain.

Figure 1: Average annual rainfall (precipitation) in Spain
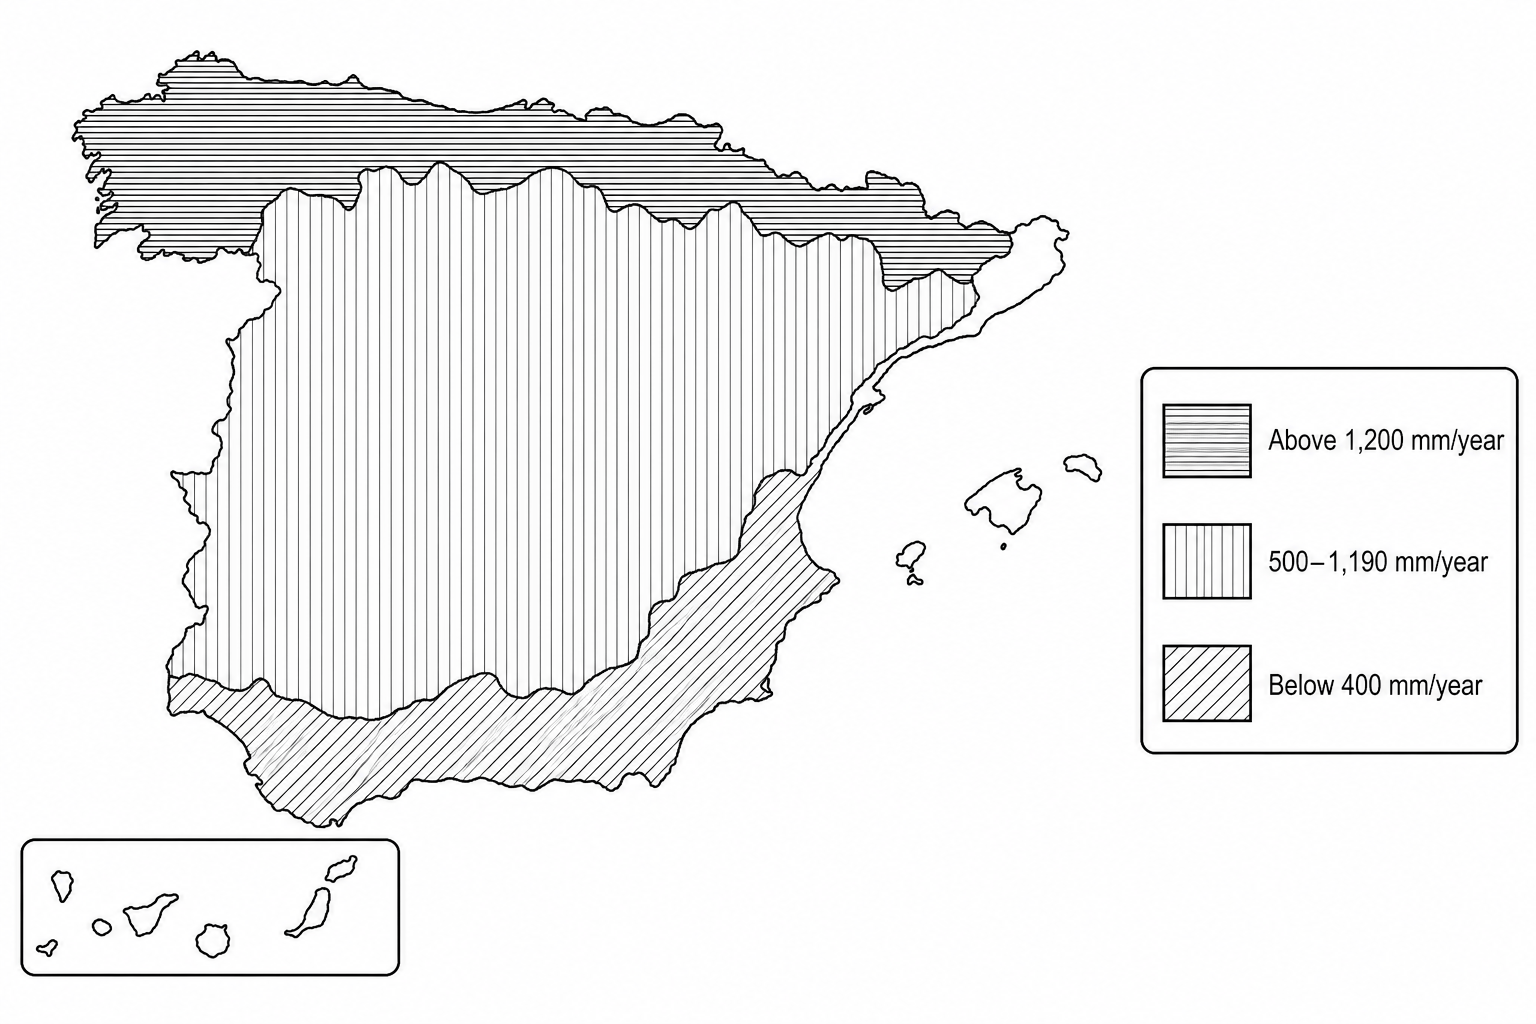
Map of Spain showing annual rainfall. The north and north-west regions are shaded dark blue, representing high rainfall (above 1,200 mm/year). The central plains are shaded light orange, representing moderate rainfall (500–1,190 mm/year). The southern and south-eastern areas are shaded red, representing very low rainfall (below 400 mm/year).

Figure 2: Regional water demand in Spain
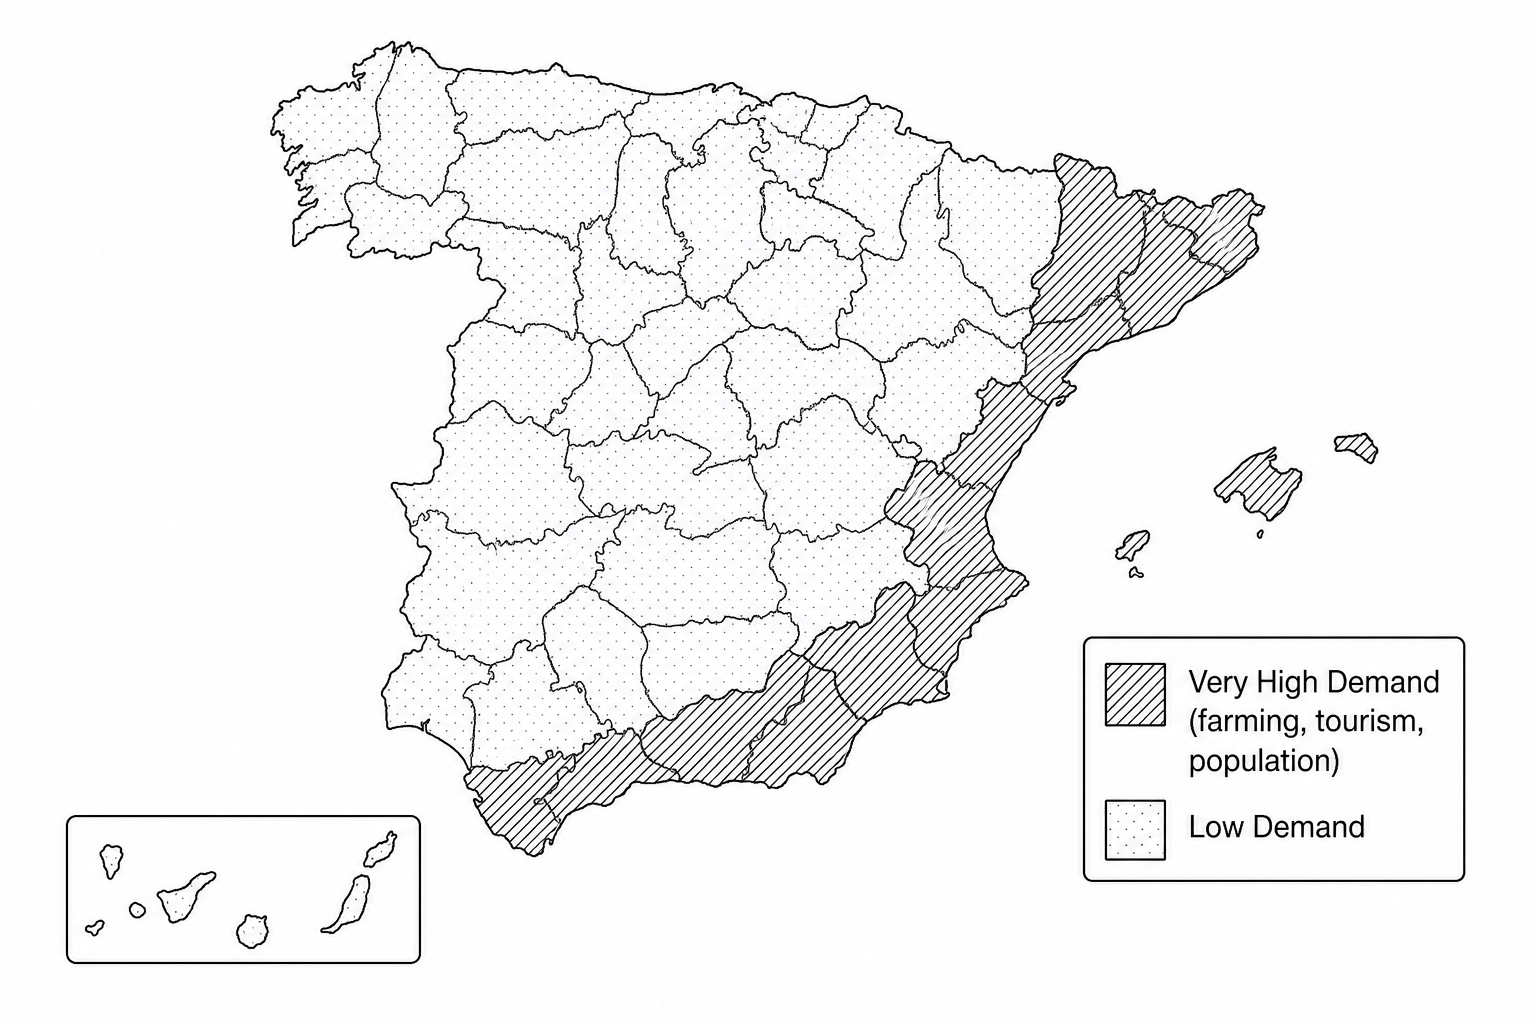
Map of Spain showing water demand levels by province. The Mediterranean coast (east and south) is shaded dark brown, indicating very high water demand driven by intensive greenhouse farming, tourism, and dense populations. The northern and central-western provinces are shaded light cream, indicating low water demand.

Using Figures 1 and 2, suggest why there might be a need for water transfer from one part of Spain to another.


[3]

Water Questions

  1. GCSE
  2. /Geography
  3. /Water