Statistical skills
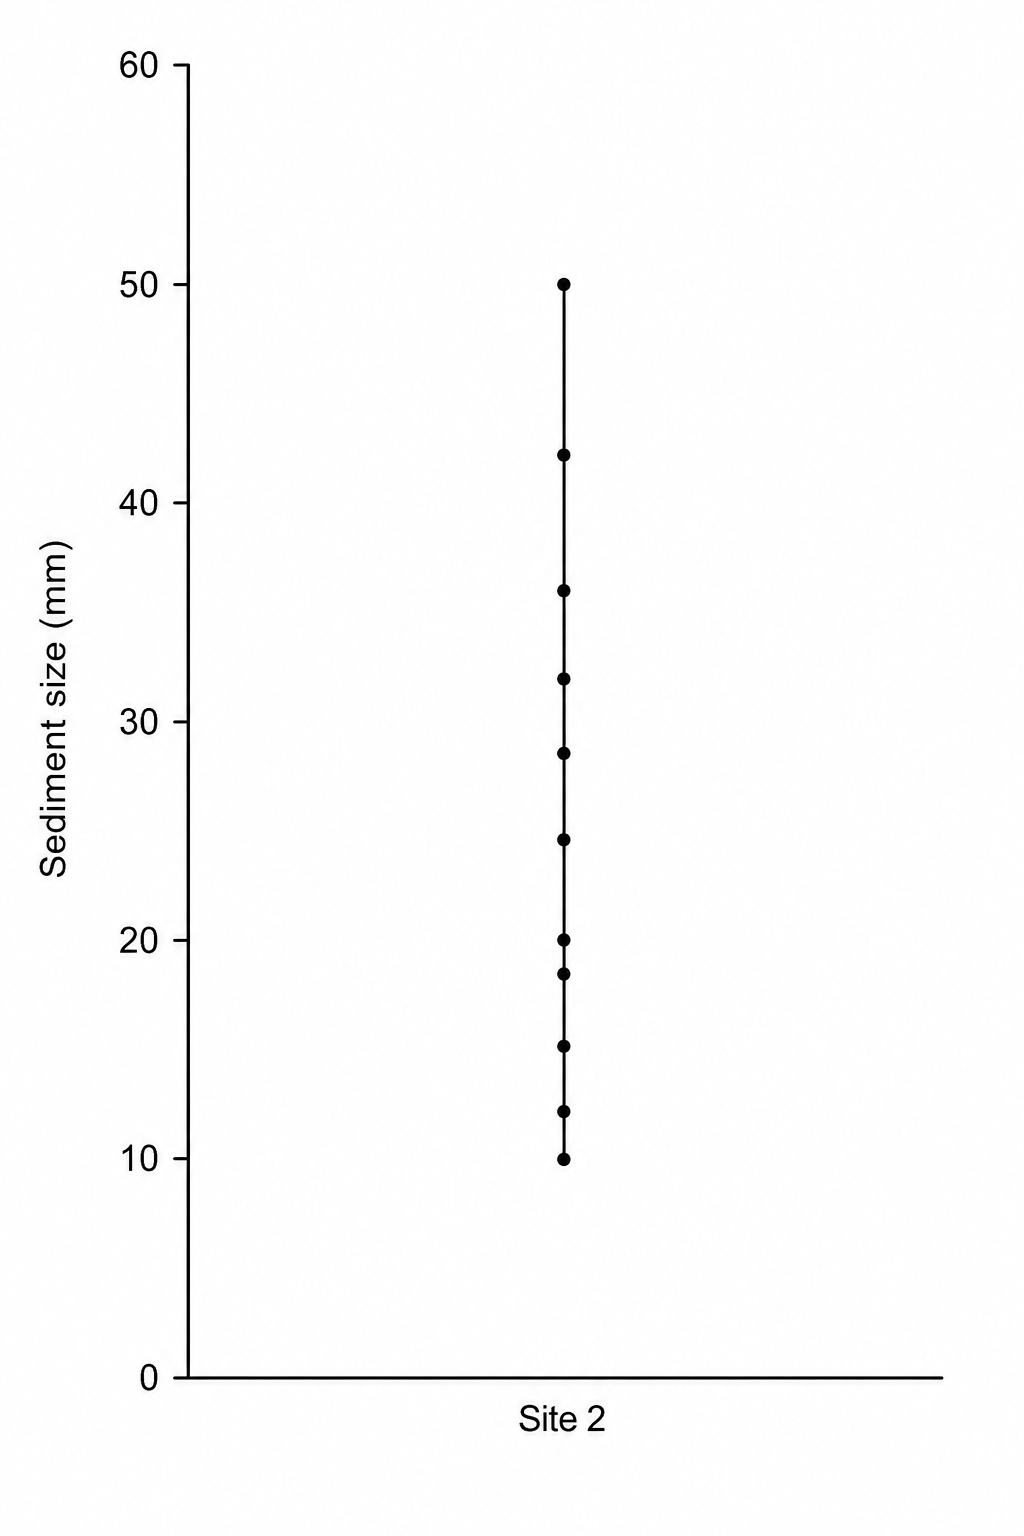
Using the data in Figure 5, calculate the interquartile range of the river sediment size data.
Show your working in the space below.
Figure 5: River sediment size at Site 2
| Sample | Sediment size (mm) |
|---|---|
| 1 | 20 |
| 2 | 12 |
| 3 | 35 |
| 4 | 15 |
| 5 | 42 |
| 6 | 28 |
| 7 | 10 |
| 8 | 50 |
| 9 | 24 |
| 10 | 18 |
| 11 | 31 |
Interquartile range = ______________ mm