Question 24
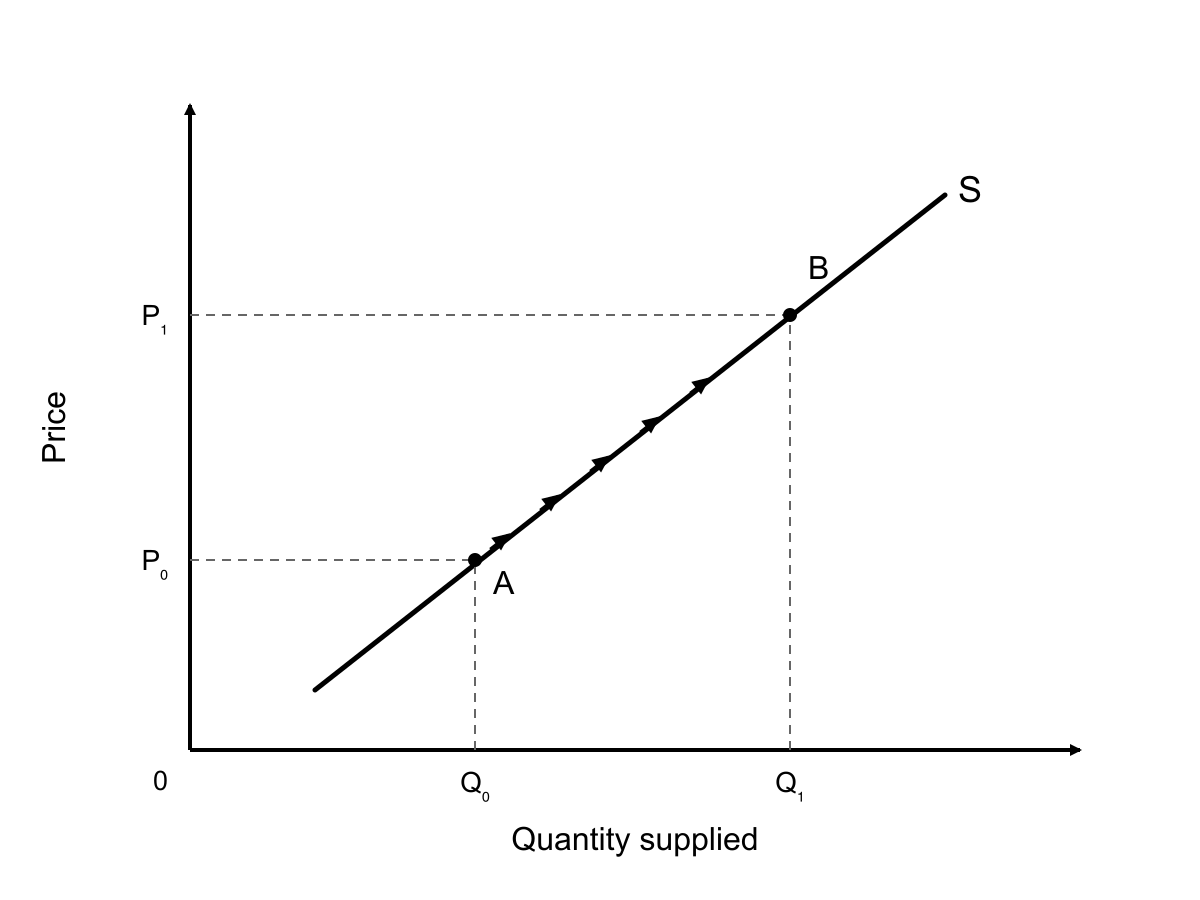
The price rises from P₀ to P₁ and the market moves from A to B. What does this show?
A
A decrease in supply.
B
An increase in supply.
C
An extension in quantity supplied along the same supply curve.
D
A contraction in quantity supplied along the same supply curve.
2.3 Supply Questions
81 exam-style questions on OCR GCSE Economics 2.3 Supply, covering 2.3.1 What is supply, 2.3.2 Draw a supply curve using data, 2.3.3 Explain a supply curve, 2.3.4 Shifts and movements of the supply curve, 2.3.5 Causes and consequences of supply changes, 2.3.6 Price elasticity of supply, 2.3.7 Draw supply curves of different elasticity, and 2.3.8 Importance of price elasticity of supply. Each one has a worked solution and a mark scheme showing where the marks go.