Skip to content

Course home

Question bank·2.3 Supply
Sign up

2.3 Supply

EasyMediumHard
1234567891011121314151617181920212223242526272829303132333435363738394041
Question 38

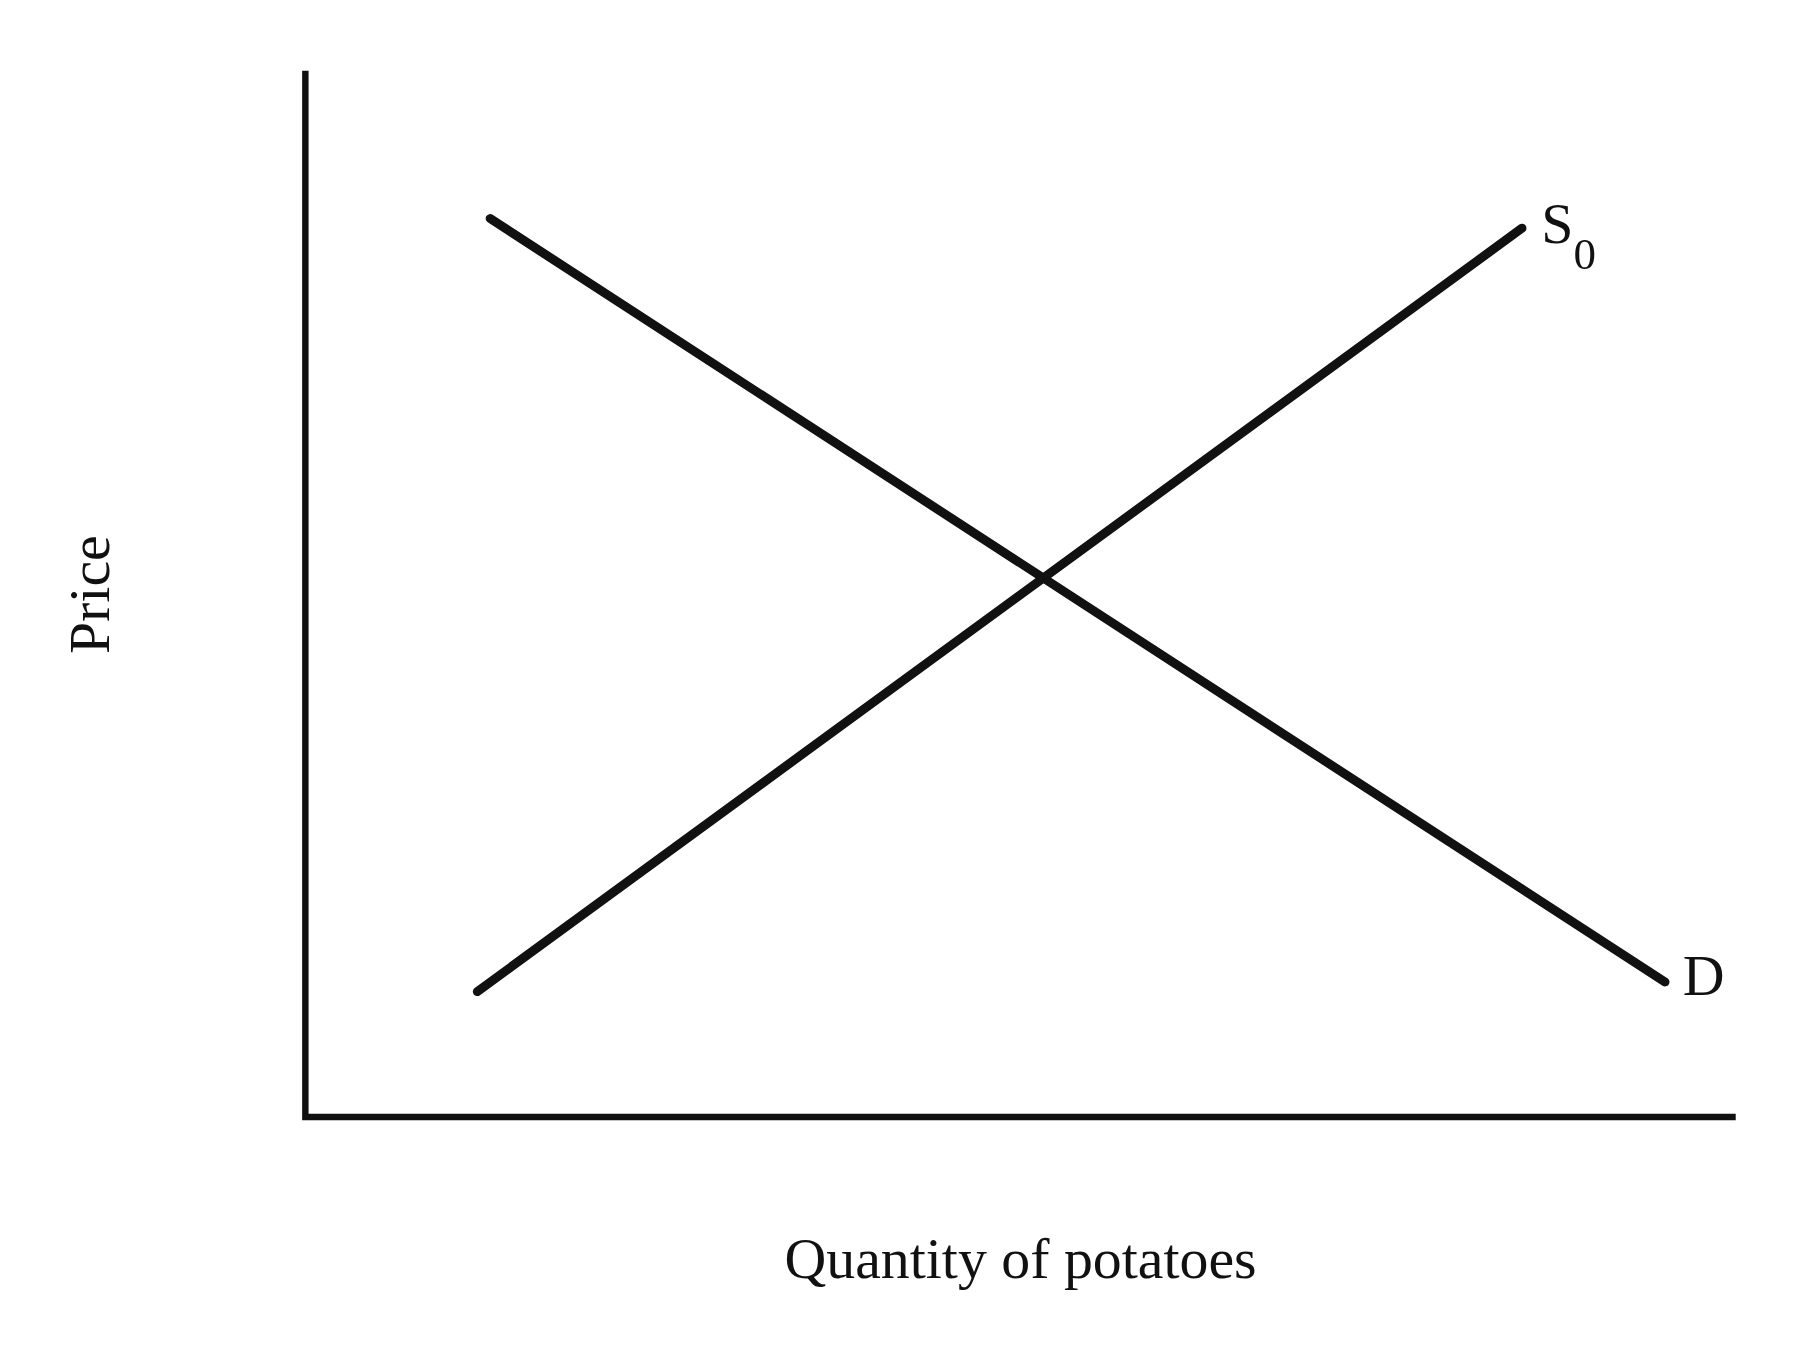
A new harvesting machine reduces the cost of producing potatoes. A potato market diagram with axes labelled Price and Quantity of potatoes and curves labelled D and S₀.

Analyse the likely consequences for potato producers and consumers.

[6]
Markscheme

2.3 Supply Questions

  1. GCSE
  2. /Economics
  3. /2.3 Supply

81 exam-style questions on OCR GCSE Economics 2.3 Supply, covering 2.3.1 What is supply, 2.3.2 Draw a supply curve using data, 2.3.3 Explain a supply curve, 2.3.4 Shifts and movements of the supply curve, 2.3.5 Causes and consequences of supply changes, 2.3.6 Price elasticity of supply, 2.3.7 Draw supply curves of different elasticity, and 2.3.8 Importance of price elasticity of supply. Each one has a worked solution and a mark scheme showing where the marks go.

More questions