Question 12
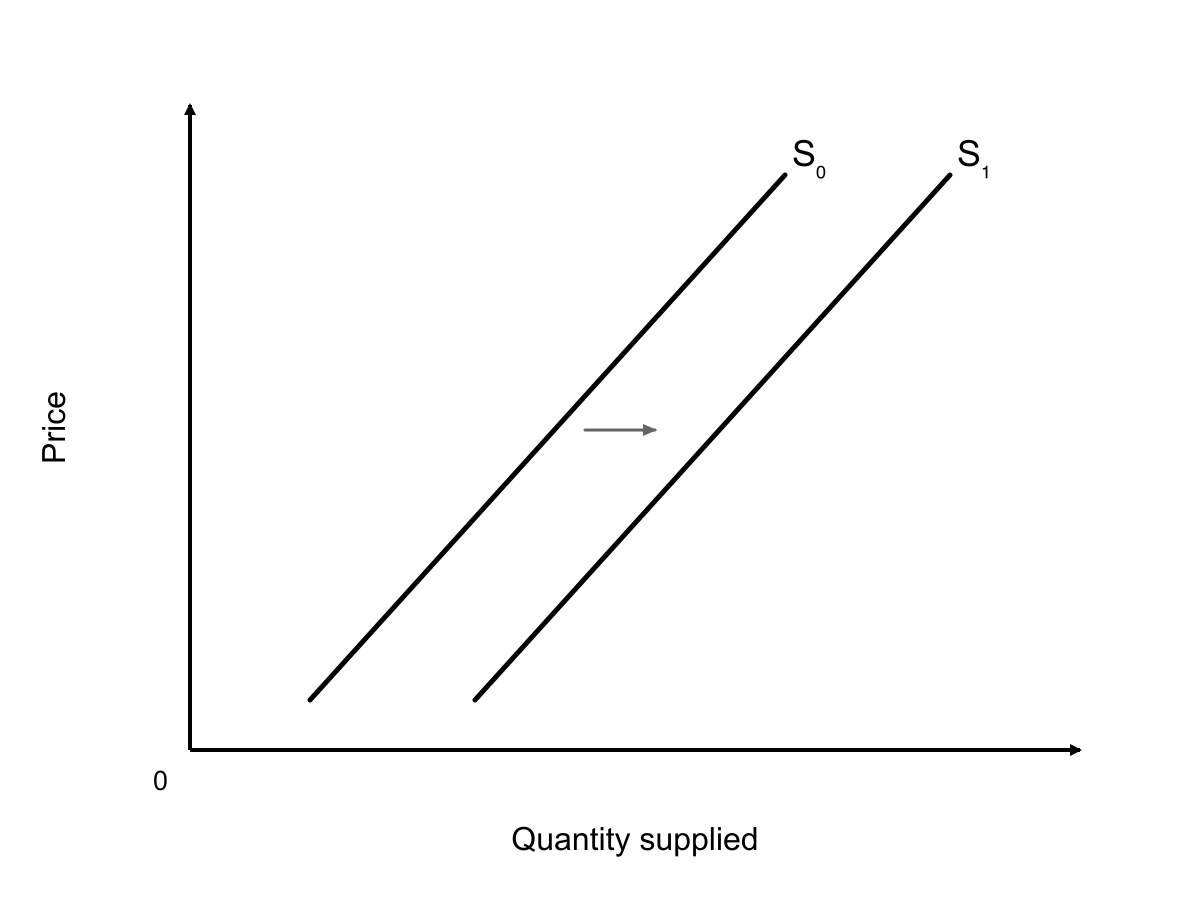
The supply curve for solar panels shifts from S₀ to S₁. Which change is most likely to have caused this?
A rise in the market price of solar panels.
An improvement in production technology.
A rise in the cost of silicon used in production.
A fall in the number of firms producing solar panels.
2.3 Supply Questions
36 exam-style questions on OCR GCSE Economics 2.3 Supply, covering 2.3.1 What is supply, 2.3.2 Draw a supply curve using data, 2.3.3 Explain a supply curve, 2.3.4 Shifts and movements of the supply curve, 2.3.5 Causes and consequences of supply changes, 2.3.6 Price elasticity of supply, 2.3.7 Draw supply curves of different elasticity, and 2.3.8 Importance of price elasticity of supply. Each one has a worked solution and a mark scheme showing where the marks go.