3.4 Price stability Questions
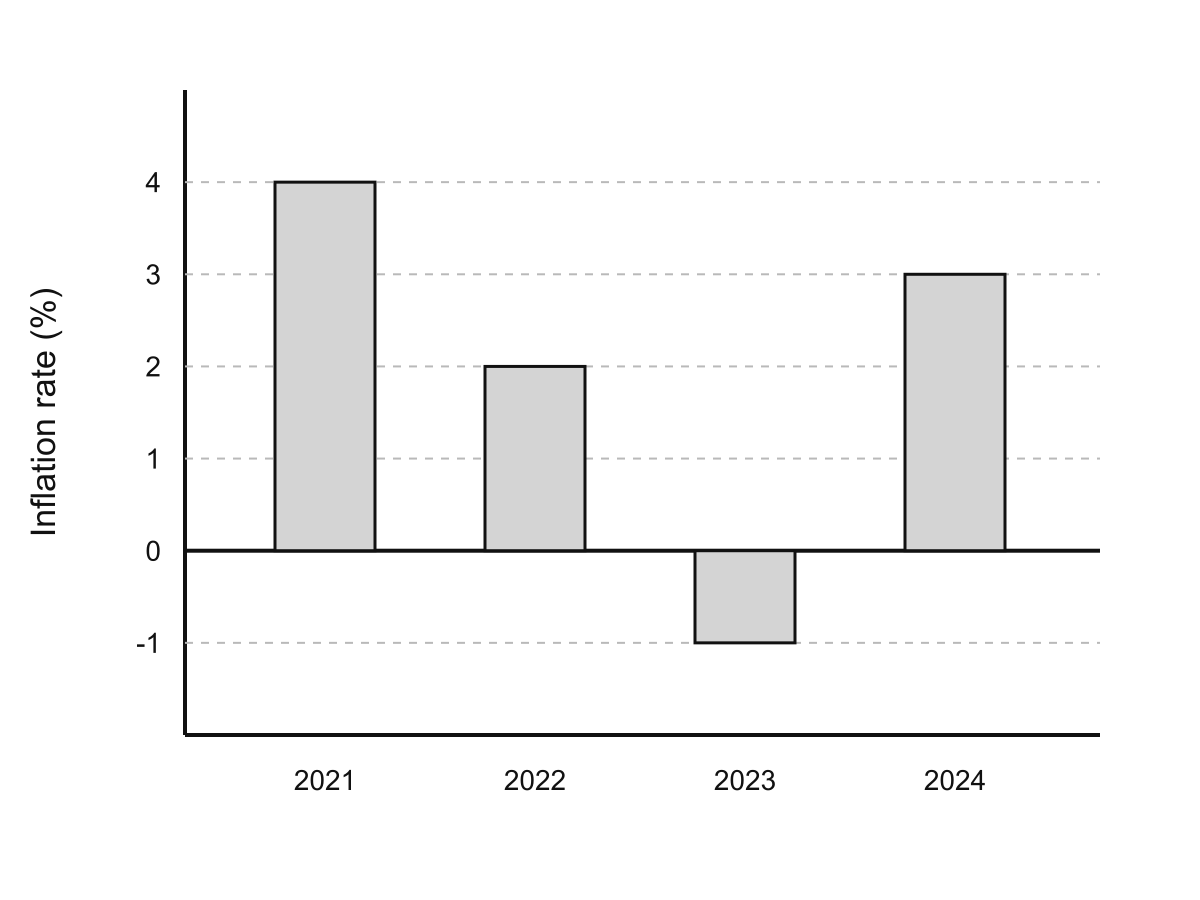
30 exam-style questions on OCR GCSE Economics 3.4 Price stability, covering 3.4.1 Price stability and inflation, 3.4.2 Measuring inflation with CPI, 3.4.3 Calculate the effect of inflation, 3.4.4 Analyse inflation figures, and 3.4.5 Causes and consequences of inflation. Each one has a worked solution and a mark scheme showing where the marks go.