Question 10
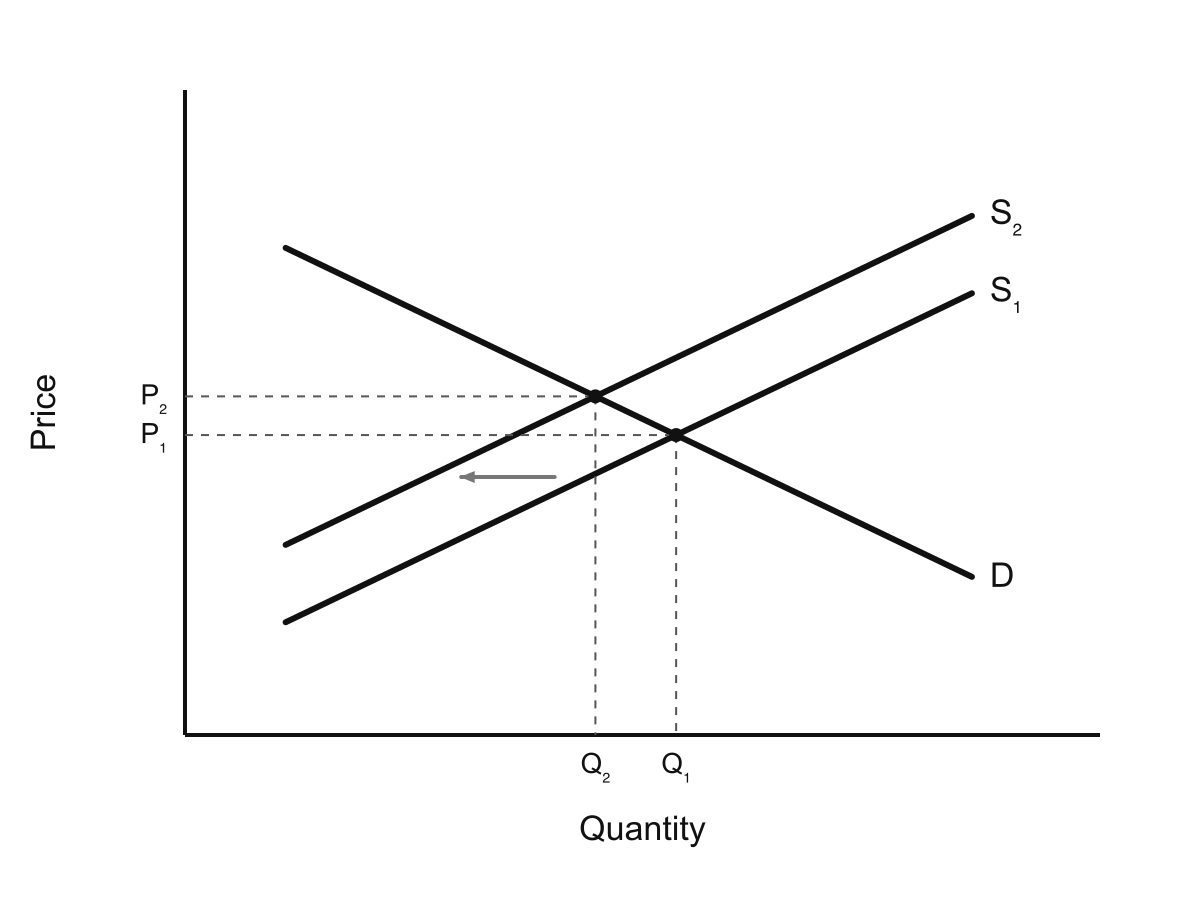
The diagram shows the market for a product that creates a negative externality. Which change is shown after the government imposes an indirect tax?
Demand shifts from D₁ to D₂
Supply shifts from S₂ to S₁
Supply shifts left from S₁ to S₂, raising price and reducing quantity
Movement along S₁ to a lower price and higher quantity
3.8 Limitations of markets Questions
31 exam-style questions on OCR GCSE Economics 3.8 Limitations of markets, covering 3.8.1 Positive and negative externalities, 3.8.2 Policies to correct externalities, 3.8.3 Impact of externality policies, and 3.8.4 Costs and benefits of externality policies. Each one has a worked solution and a mark scheme showing where the marks go.