Question 14
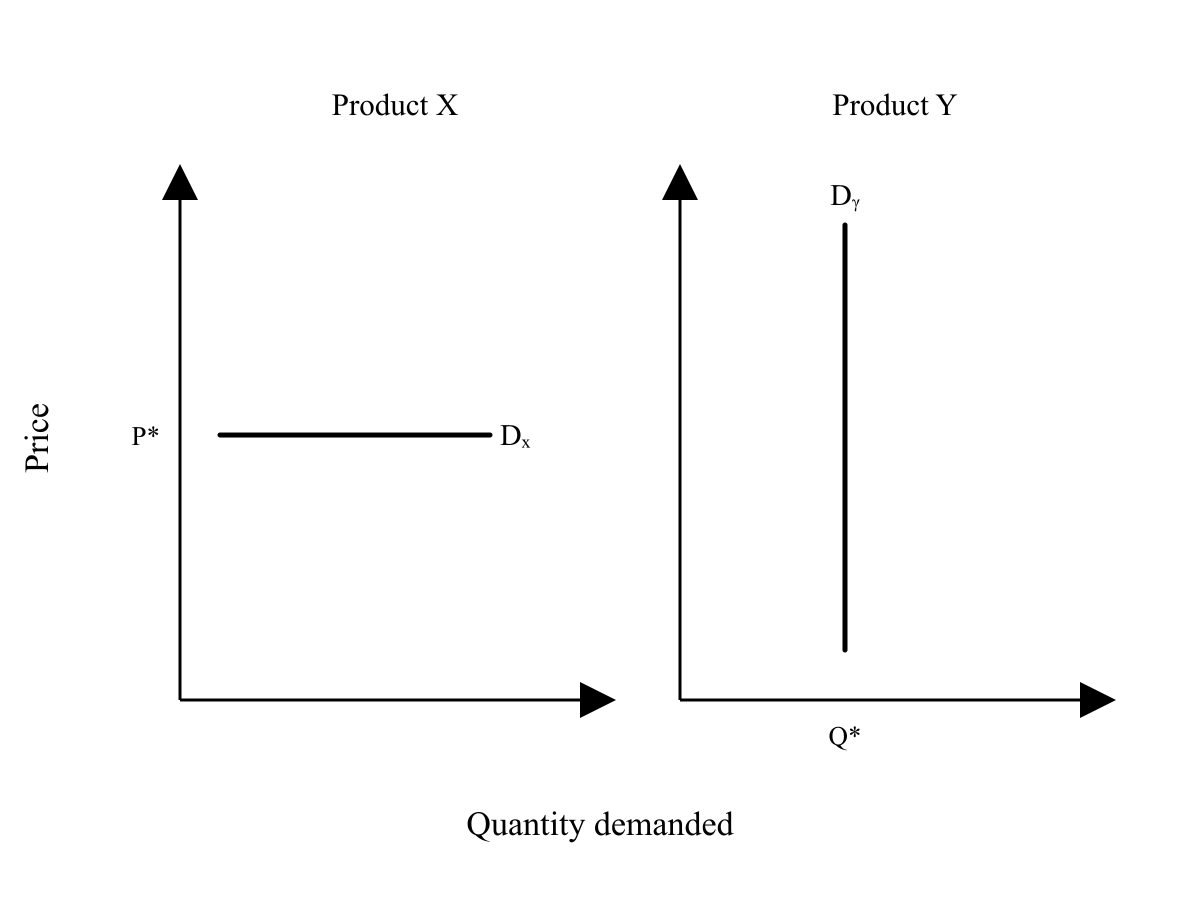
The diagrams show two extreme demand curves. Which statement correctly compares the pricing power of the two firms?
Firm X can raise its price above P* without losing any sales, while Firm Y loses all sales
Firm Y can raise its price within the range shown without reducing quantity demanded, while Firm X would lose demand above P*
Both firms lose the same proportion of sales after a price rise because both curves are demand curves
Neither firm can change total revenue because quantity demanded is fixed for both products
2.2 Demand Questions
41 exam-style questions on OCR GCSE Economics 2.2 Demand, covering 2.2.1 What is demand, 2.2.2 Draw a demand curve using data, 2.2.3 Explain a demand curve, 2.2.4 Shifts and movements of the demand curve, 2.2.5 Causes and consequences of demand changes, 2.2.6 Price elasticity of demand, 2.2.7 Draw demand curves of different elasticity, and 2.2.8 Importance of price elasticity of demand. Each one has a worked solution and a mark scheme showing where the marks go.