Total cost is fixed cost plus variable cost
- What each of these six quantities means is set out in 2.6.4; this article is about working them out from data.
- Add the fixed cost to the variable cost to get the total cost, and find the variable cost by multiplying the cost per unit by the output.
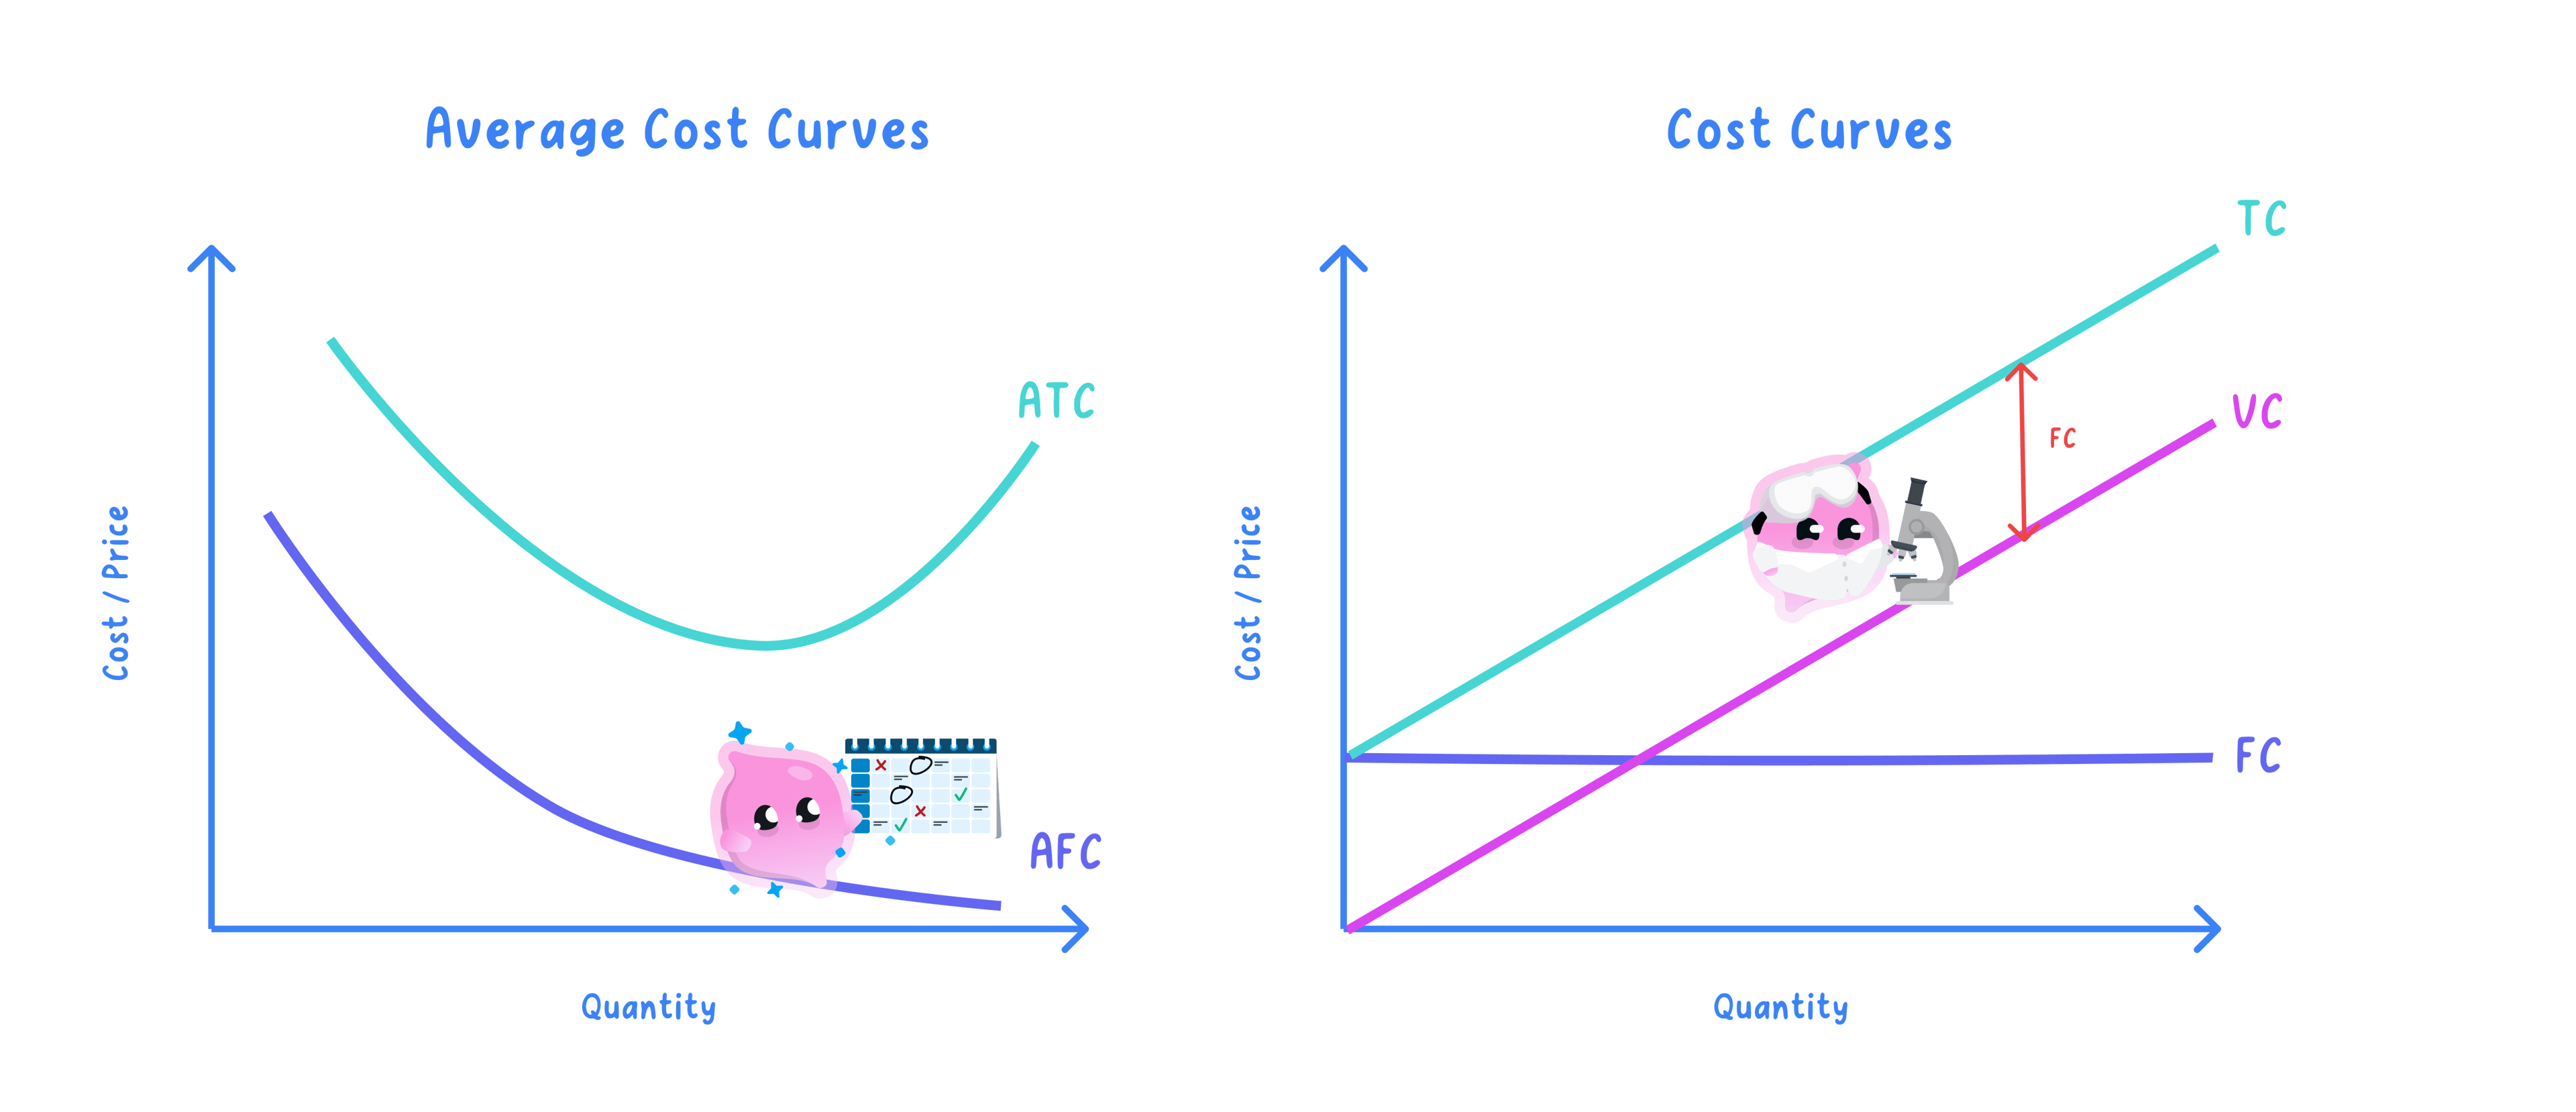
The same costs drawn as a graph
- The right-hand panel shows the totals, so it answers what the whole run costs at each level of output.
- FC is a flat line because fixed costs do not change with output, and VC rises from the origin because every extra unit adds to it.
- TC sits above VC and rises with it, and the gap between the two lines is the fixed cost, which is what the arrow marked FC is measuring.
- TC starts partway up the vertical axis rather than at zero, because a firm producing nothing still has its fixed costs to pay.
- The left-hand panel shows the same costs per unit, so it answers what one unit costs on average.
- AFC falls all the way across, because the same fixed sum is being shared over more and more units.
- ATC falls at first for that same reason, then turns upwards once the firm is stretched beyond the size it runs most cheaply at, which is the limit covered in 2.6.6.
- In short, the right-hand panel is what you add up and the left-hand panel is what you divide.
Note
- This spec point asks you to calculate total cost, average cost, total revenue, average revenue, profit and loss. It does not ask you to draw or label cost curves.
- AFC and the U-shaped ATC go further than J205 needs, so use this diagram to picture what the arithmetic is doing rather than as something to reproduce in an exam.
Average cost divides total cost by output
- Divide by the number of units produced, not by the fixed cost, because average cost is the cost of one unit on average.
- Average cost falls as output rises while fixed costs stay the same, since the same fixed sum is spread over more units.
- Keep the units consistent, so a weekly fixed cost must be divided by a weekly output.
Example
- A bakery has fixed costs of £600 a week, a variable cost of £0.40 a loaf, and sells loaves at £1.20. It bakes 2,000 loaves a week.
Step 1: find the variable cost by multiplying the cost per loaf by the output:
2,000×£0.40=£800 2{,}000 \times \pounds0.40 = \pounds800 2,000×£0.40=£800Step 2: add the fixed cost to get the total cost:
£600+£800=£1,400 \pounds600 + \pounds800 = \pounds1{,}400 £600+£800=£1,400Step 3: divide the total cost by the output to get the average cost:
£1,4002,000=£0.70 a loaf \frac{\pounds1{,}400}{2{,}000} = \pounds0.70\text{ a loaf} 2,000£1,400=£0.70 a loaf- Each loaf costs 70p on average to produce, even though only 40p of that is the variable cost of the ingredients.
Revenue comes from price times quantity sold
- Multiply the price by the quantity sold, using the price actually charged rather than any cost figure.
- Average revenue is the total revenue divided by the quantity sold, which equals the price when every unit sells at the same price.
- That equality is a useful check, so an average revenue that does not match the price means an arithmetic slip.
Example
- The same bakery sells all 2,000 loaves at £1.20.
Step 1: multiply the price by the quantity sold:
£1.20×2,000=£2,400 \pounds1.20 \times 2{,}000 = \pounds2{,}400 £1.20×2,000=£2,400Step 2: divide by the quantity sold to check the average revenue:
£2,4002,000=£1.20 \frac{\pounds2{,}400}{2{,}000} = \pounds1.20 2,000£2,400=£1.20- Average revenue equals the £1.20 price, which confirms the total revenue figure is right.
Profit is revenue minus total cost
- Subtract the total cost from the total revenue and read the sign, because a positive answer is a profit and a negative one a loss.
- Use total cost, not variable cost, since a firm has to cover its fixed costs too before it makes anything.
- Comparing average cost with the price gives the same answer more quickly, because a price above average cost means a profit on every unit.
Example
- The bakery's figures at two levels of output, with fixed costs of £600 a week throughout.
| Loaves a week | Fixed cost | Variable cost | Total cost | Average cost | Total revenue | Profit or loss |
|---|---|---|---|---|---|---|
| 500 | £600 | £200 | £800 | £1.60 | £600 | −£200 |
| 2,000 | £600 | £800 | £1,400 | £0.70 | £2,400 | +£1,000 |
Step 1: at 2,000 loaves, subtract the total cost from the total revenue:
£2,400−£1,400=+£1,000 profit \pounds2{,}400 - \pounds1{,}400 = +\pounds1{,}000\text{ profit} £2,400−£1,400=+£1,000 profitStep 2: at 500 loaves, do the same:
£600−£800=−£200 loss \pounds600 - \pounds800 = -\pounds200\text{ loss} £600−£800=−£200 loss- At 500 loaves the average cost of £1.60 is above the £1.20 price, which is why the bakery loses 40p on every loaf it sells.
Reading a cost and revenue table
- Work along a row rather than down a column, because every figure in a row belongs to the same level of output.
- Check the fixed cost stays the same at every output, since a changing fixed cost means you have misread the table.
Exam technique
- Show the working line by line, because a right answer with no method loses the marks for the method.
- Label a negative answer as a loss in words, and give the amount as a positive number when you name it.
Self review
- Fixed costs are £400 and variable costs £600. What is total cost?
- Total cost is £1,000 and output is 500 units. What is average cost?
- A firm sells 300 units at £8. What is total revenue?
- Revenue is £2,000 and total cost £2,300. State the profit or loss.
- Why is average revenue equal to the price when all units sell at the same price?
