Read the axes before you read the lines
- Start with the vertical axis and check what it measures and in what units, because a chart of values in £ billion answers different questions from one of percentage changes.
- Then check the horizontal axis for the period covered and whether the points are quarters or years, since a quarterly series moves far more than an annual one.
- Check whether the vertical scale starts at zero, because a scale that starts higher up makes small movements look dramatic.
- Only once the axes are clear does it make sense to describe what the lines are doing.
Bar charts and line charts show trade differently
- A bar chart groups the periods, with imports in one colour and exports in another, so the two heights for a named year can be compared at a glance.
- A line chart joins the points instead, so the direction of travel across the whole period is easier to see than in a row of bars.
- A turning point, where a line stops rising and starts falling, is the feature a line chart shows immediately and a bar chart makes you work out year by year.
- The two panels above hold exactly the same figures, so the choice between them is a choice about what you want to show rather than a difference in the data.
The gap between the lines is the balance
- On a chart showing exports and imports together, the trade balance is the vertical gap between the two lines, not the height of either one.
- Where the import line sits above the export line the country is in deficit for that period, and the size of the deficit is the size of the gap.
- A gap that widens means the balance is worsening even when both lines are rising, as in the charts above where the gap grows from £20 billion in 2023 to £40 billion in 2025.
- Reading one line on its own is therefore unsafe, because exports can grow strongly while imports grow faster still.
Compare direction and size between named years
- Name the two years you are comparing, give the direction of change first, then its size, and quote both figures with their units.
- Find the change by subtracting the earlier figure from the later one, so a positive answer is a rise and a negative answer is a fall.
- To decide which of two lines rose more between the same two years, compare the two changes, never the two heights, because the higher line can be the one that moved less.
Example
- The UK trade deficit with all countries was £8.0 billion in the three months to June 2026, compared with £7.7 billion in the previous three months.
- The direction is a widening of the deficit, and its size is £0.3 billion against a deficit of about £8 billion, which is a small movement.
- Two periods are not a trend, so the safe description is a deficit that was broadly stable and slightly wider, not one on a rising path.
A slower rise is not a fall
- A fall in the level means the figure itself is smaller than it was, and the line on the chart slopes downwards.
- A fall in the rate of increase means the figure is still growing, just more slowly, and the line still slopes upwards but less steeply.
- A statement that imports fell is therefore only true where the import line actually goes down, and a flatter upward slope does not qualify.
- The same care applies to a claim that imports always exceeded exports, which holds only if the import line stays above the export line at every point, so check the whole period rather than the two ends.
Reading a real chart of UK goods trade
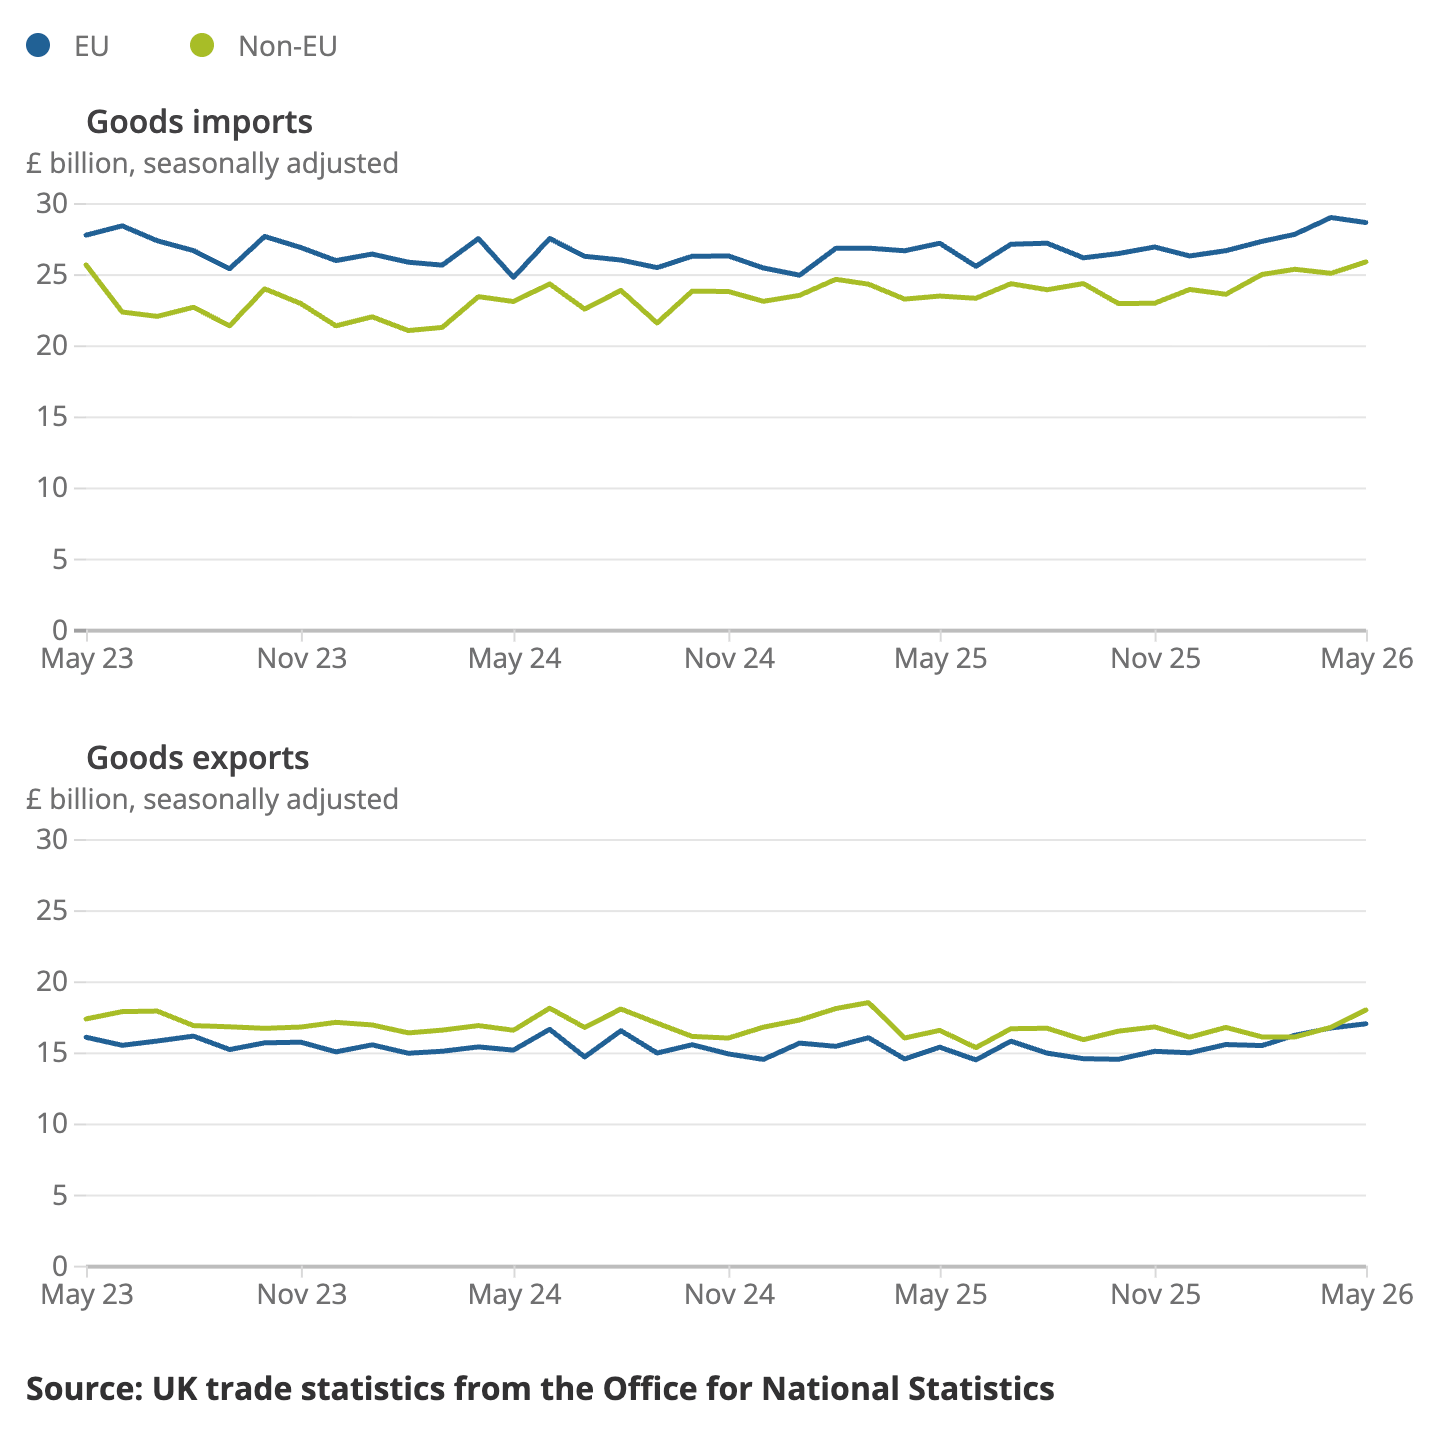
- Both panels are measured in £ billion a month, seasonally adjusted, and both run from 0 to 30, so the upper panel and the lower one can be compared directly.
- Goods imports run at roughly £21 billion to £29 billion a month and goods exports at roughly £15 billion to £18 billion, so the UK is in deficit on goods in every month shown (Source: ONS).
- The EU is the higher line for imports and the lower one for exports, though the two export lines close up towards the end of the period, which is why an always claim has to be checked across the whole chart.
- Month to month the lines are jagged, but across three years they are close to flat, so the honest description is broadly stable rather than rising or falling.
Recent UK data shows the pattern to expect
- The EU accounted for 41% of UK exports of goods and services and 49% of UK imports in 2025, so it remains the UK's largest trading partner (Source: ONS).
- In 2025 the UK ran a trade deficit of £90 billion with the EU and a trade surplus of £51 billion with non-EU countries.
- One headline figure can therefore hide two opposite patterns, which is why trade data is usually broken down by partner or by goods and services.
- Expect UK charts to show imports above exports for goods and exports above imports for services, and check which of the two a chart is showing before describing it.
Common Mistake
- Do not combine figures from different breakdowns, because a deficit with one partner and a surplus with another may be measured over different periods or cover different products.
- A single year of change is not a trend, so avoid describing one movement as a rising or falling path.
Writing up what the data actually shows
- Describe exports first, then imports, then the gap, and finish by saying whether the position improved or worsened over the period.
- Support each statement with a figure, its units and its year, because a description that could fit any chart earns nothing.
Why the gap between exports and imports widens or narrows in the first place is covered in 4.2.6.
Exam technique
- Test each statement offered about a chart against the axis units and the exact years it names, rather than against the general shape.
- Where a statement compares the two lines, check the gap at several points across the period, since crossing lines can make an always claim false at one point only.
- Reject any statement that says a figure fell when the line merely rose more slowly.
Self review
- What two things should you check on the axes before describing a chart?
- On a chart of exports and imports, what does the vertical gap between the lines show?
- Both lines rise, but imports rise faster. What has happened to the balance?
- Explain the difference between a fall in imports and a fall in the growth of imports.
- What share of UK exports of goods and services went to the EU in 2025?
