Reading a rate series starts with direction
Definition
Appreciation: a rise in the value of a currency against another currency, so each unit of it buys more foreign currency than before.
Depreciation: a fall in the value of a currency against another currency, so each unit of it buys less foreign currency than before.
- Exchange rate data usually arrives as a series: the same currency pair recorded on a run of dates, such as dollars per pound month by month.
- The first job is always direction, found by comparing the rate at the end of the period with the rate at the start.
- Settle the direction before anything else, because every later comment depends on getting it the right way round.
Read a sterling chart month by month
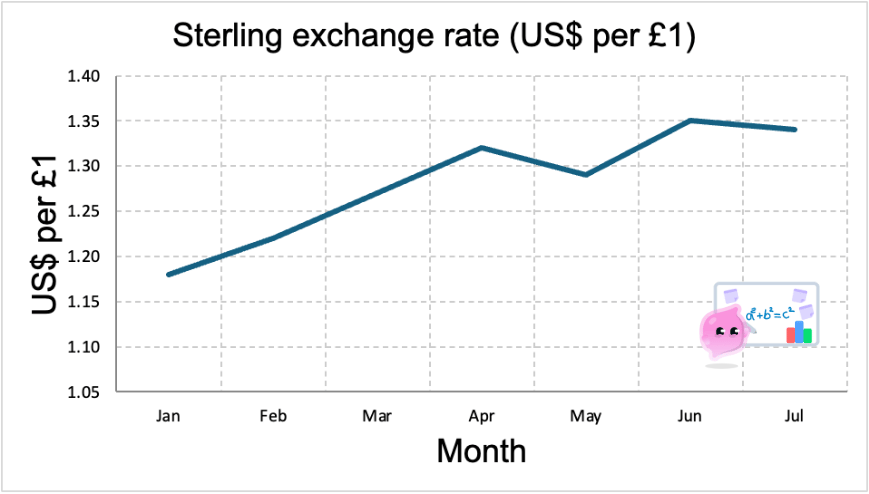
- The title says US dollars per £1, so the pound is the currency being priced and a rising line means each pound buys more dollars.
- The rate climbs from 1.18 dollars in January to 1.34 dollars in July, a rise of 16 cents, so the pound appreciated across the seven months.
- The dips in May, from 1.32 to 1.29 dollars, and in July, from 1.35 to 1.34 dollars, run against that direction but each lasts one month, so they are blips rather than a change of trend.
- The vertical axis starts at 1.05 rather than zero, which makes the climb look steeper than it is, because 16 cents on a starting rate of 1.18 dollars is a rise of about 14%.
Which currency is quoted first decides everything
- A rate always prices one currency in units of another, and the currency being priced is the one the figures are attached to.
- The identical movement therefore shows up as a rise in one table and a fall in another, which is the single commonest trap in this data.
- Quoted the other way round, as pounds per dollar, the same seven months would fall from about £0.85 to about £0.75, and that same appreciation of the pound would appear on the page as a decline.
- Read the heading, decide which currency is being priced, and only then look at whether the figures are going up or down.
Common Mistake
- An appreciation or depreciation is a currency's value against another currency, not the general price level inside the country.
- A country can have rising prices at home and a rising currency abroad in the same month, so never treat the two as one measurement.
One day is not a trend
- A single day's movement can come from one announcement and be reversed the following week, so it says little about where the currency is heading.
- A trend is a run of moves in the same direction across months, and it is trends rather than daily wobbles that change what exporters and importers actually do.
- Bring the time into the size as well, because a move of a few cents spread over a year is unremarkable while the same move inside a single trading day is not.
Example
- In a long run of dollars per pound, the lowest figure ever recorded is about 1.035 dollars, on 26 September 2022.
- Read as data, that is the trough of the series rather than its trend, so the right comment is to name it as an extreme and then say where the rate settled afterwards.
- The same series also shows a sharp fall against the dollar immediately after the June 2016 referendum on EU membership.
- Naming both is part of a good reading, because a series is described by its extremes and its turning points as well as by its overall direction.
Live charts can show change, not level
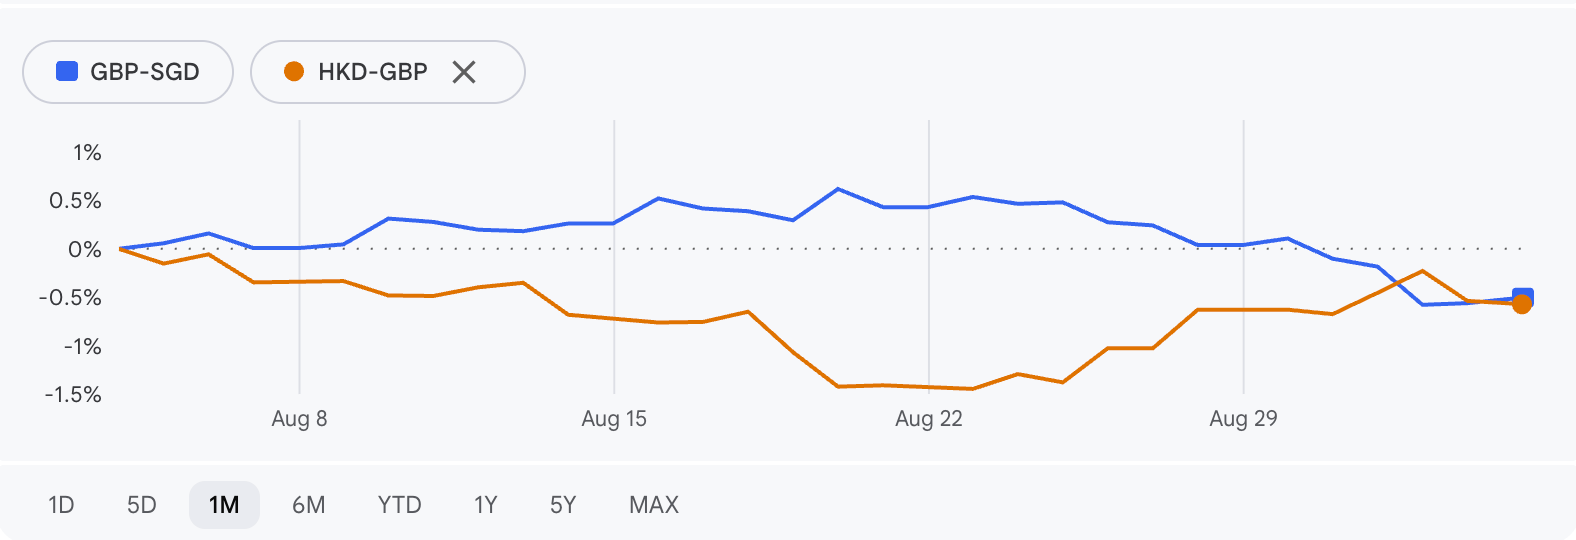
- This chart plots percentage change from the start of the month rather than the rate itself, so the zero line is where each pair began and not a rate of zero (Source: Google Finance).
- The two pairs are quoted in opposite directions, because GBP to SGD prices the pound in Singapore dollars while HKD to GBP prices the Hong Kong dollar in pounds.
- So the falling blue line means the pound weakened against the Singapore dollar, while the falling orange line means the Hong Kong dollar weakened against the pound, which is the pound strengthening.
- Reading both lines as the pound falling would therefore be wrong, and it is the heading rather than the shape of the line that tells you so.
Turning a reading into a conclusion
- A complete reading of a series names three things: the direction of travel, the size of the move, and whether it is a blip or a trend.
- Always attach the period, because the pound fell means very little until you say over what stretch of time it fell.
- Where the data covers more than one currency pair, treat each pair separately rather than talking about the pound in general.
What an appreciation or a depreciation then does to UK consumers and UK producers is set out in 4.3.5.
Exam technique
- Quote both rates and both dates when you describe a change, because a claim that the pound weakened cannot be checked against the data unless the figures are in the answer.
- Always say against which currency, since the same pound can have appreciated against one currency and depreciated against another over the identical period.
Self review
- The number of dollars per pound rises. Has the pound appreciated or depreciated?
- A table is headed pounds per dollar and the figures rise. What has happened to the pound?
- Name two things to report about a move besides its direction.
- Why is a single day's fall weaker evidence than a fall spread over several months?
- A chart's vertical axis starts at 1.05 rather than zero. What does that do to how the movement looks?
