Question 16
Figure 1 shows an individual's demand curve for theatre tickets. The ticket price changes from £10 to £6.
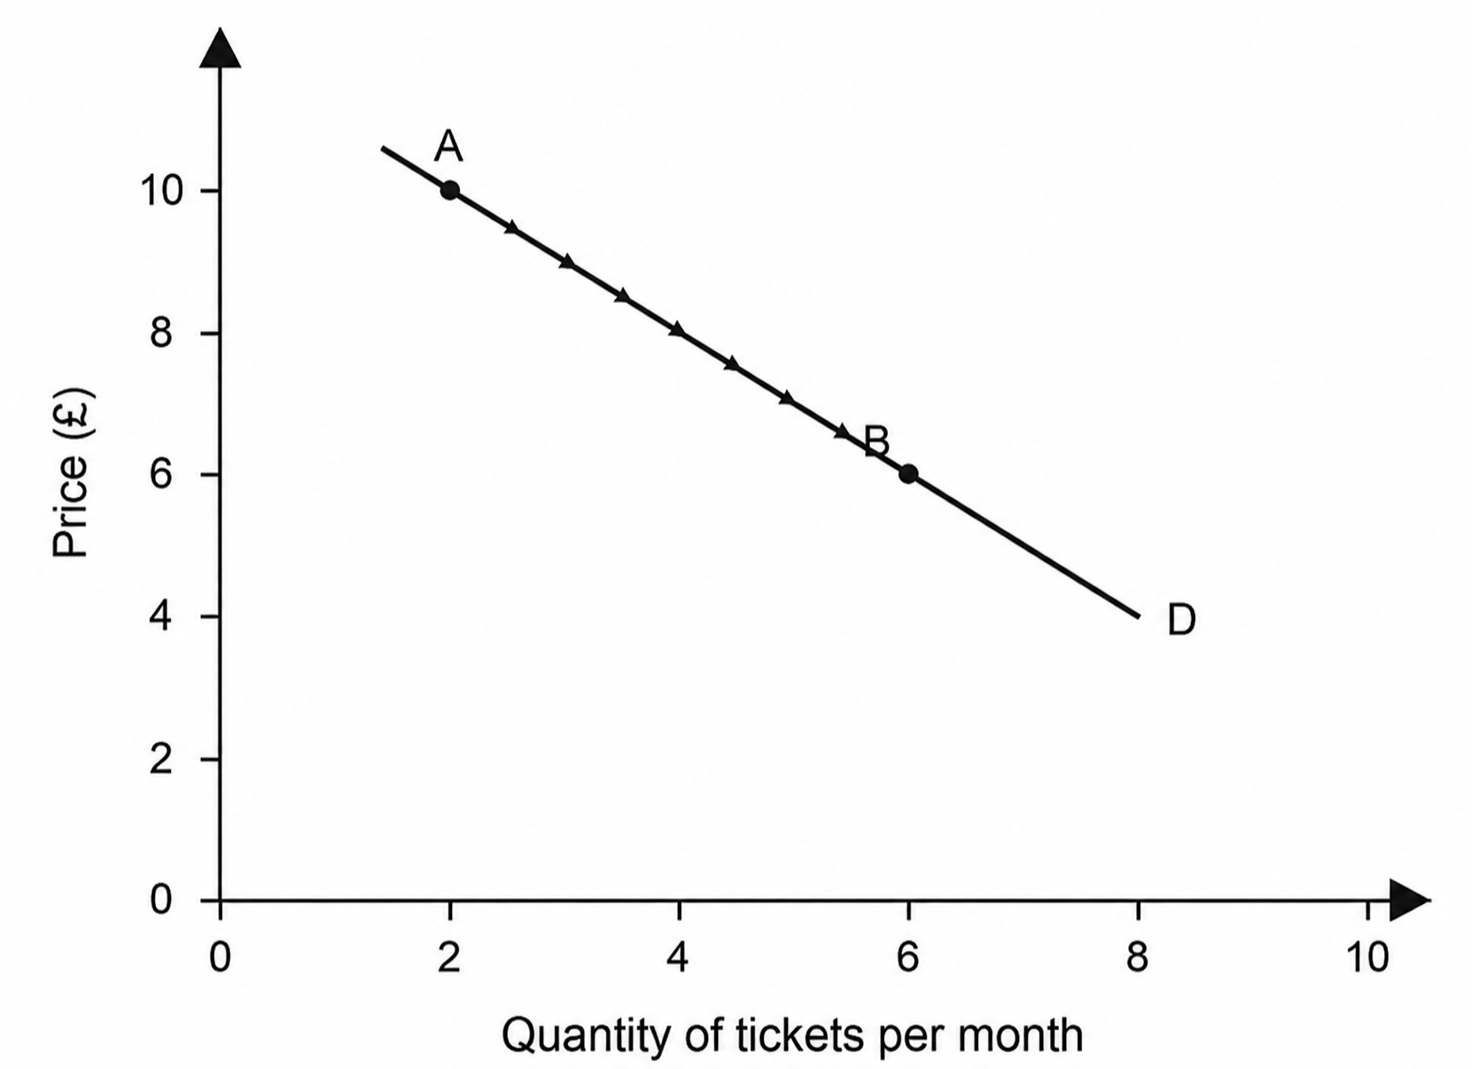 Which of the following best describes the change shown in Figure 1?
Demand decreases and the demand curve shifts left
Demand increases and the demand curve shifts right
Quantity demanded decreases and there is a movement up the demand curve
Quantity demanded increases and there is a movement down the demand curve
1.3 How prices are determined Questions
236 exam-style questions on AQA GCSE Economics 1.3 How prices are determined, covering 1.3.1a Demand and the factors that influence it, 1.3.1b The demand curve, 1.3.2a Supply and the factors that influence it, 1.3.2b The supply curve, 1.3.3a Determining equilibrium price, 1.3.3b Applying diagrams and showing revenue, 1.3.4a Complements and substitutes, 1.3.4b Effects of changes on related markets, 1.3.5a Price elasticity of demand, 1.3.5b Factors affecting price elasticity of demand, 1.3.5c Measuring PED and its implications, 1.3.6a Price elasticity of supply, 1.3.6b Factors affecting price elasticity of supply, and 1.3.6c Measuring PES and its implications. Each one has a worked solution and a mark scheme showing where the marks go.