x

Revision notes for AQA GCSE Chemistry Flame emission spectroscopy. Open the guide for explanations and worked examples. Written against the AQA GCSE Chemistry (8462) specification, so the content matches what's examinable rather than general Chemistry background.

Flame emission spectroscopy

What you'll learn

  • How flame emission spectroscopy identifies metal ions in solutions.
  • Why different metal ions produce different line spectra.
  • How to use reference spectra to identify unknown ions.
  • How emission intensity can be used to estimate concentration.

Starting point: metal ions in solution

A metal ion is a positively charged particle formed when a metal atom loses one or more electrons. In solution, metal ions are usually written with state symbol (aq), meaning aqueous: dissolved in water.

Examples include sodium ions, Na⁺(aq), potassium ions, K⁺(aq), lithium ions, Li⁺(aq), and calcium ions, Ca²⁺(aq).

In earlier qualitative tests, you may have met flame tests, where some metal ions produce characteristic flame colours. For example, sodium ions give a yellow flame and potassium ions give a lilac flame.

Definition

Flame emission spectroscopy

Flame emission spectroscopy is an instrumental method used to analyse metal ions in solutions by measuring the light emitted when the ions are heated in a flame.

Key Idea

The big idea

A metal ion heated in a flame gives out light at specific wavelengths. These wavelengths form a pattern called a line spectrum, which can identify the ion.

Why use an instrumental method?

An instrumental method uses scientific equipment to carry out analysis, rather than relying only on human observation.

Flame tests by eye are useful, but they have limits. Colours can look similar, weak colours can be hard to see, and a bright ion such as sodium can mask other ions. Flame emission spectroscopy is more precise because it records the actual wavelengths and intensities of light.

Instrumental methods are often:

  • More sensitive — they can detect small amounts.
  • More accurate — they give numerical data.
  • More reliable — they reduce judgement based on eyesight.
  • Faster for analysing many samples.
Common Mistake

Instrumental does not mean automatic proof

An instrumental result still needs interpreting carefully. You must compare the unknown spectrum with the reference data provided.

Light, wavelengths and spectra

Light can be described using wavelength. The wavelength is the distance between matching points on neighbouring waves. In flame emission spectroscopy, wavelengths are often measured in nanometres, nm.

A spectrum is a display of light separated into its different wavelengths.

Definition

Line spectrum

A line spectrum is a spectrum made of sharp lines at specific wavelengths, rather than a continuous band of colours.

Each metal ion produces a particular set of lines. You can think of this as the ion’s “fingerprint”.

Analogy

Fingerprint pattern

A person is not identified by one random mark on a finger; they are identified by the pattern. In the same way, a metal ion is identified by the pattern of lines in its spectrum.

What happens inside the flame?

When the sample enters the flame, the metal ions absorb energy from the heat. This makes electrons in the ions move to higher energy levels. They are then described as excited.

The excited electrons are unstable, so they fall back down to lower energy levels. When this happens, energy is released as light.

Different metal ions have different electron arrangements, so they release different wavelengths of light.

Definition

Excited electron

An excited electron is an electron that has absorbed energy and moved to a higher energy level.

Key Idea

Why the lines are specific

The wavelengths emitted depend on the energy changes inside the ion, so different metal ions produce different line spectra.

The flame emission spectroscopy process

In flame emission spectroscopy, the sample is placed into a flame and the light given out is passed through a spectroscope.

A spectroscope is an instrument that separates light into its different wavelengths so the spectrum can be observed or recorded.

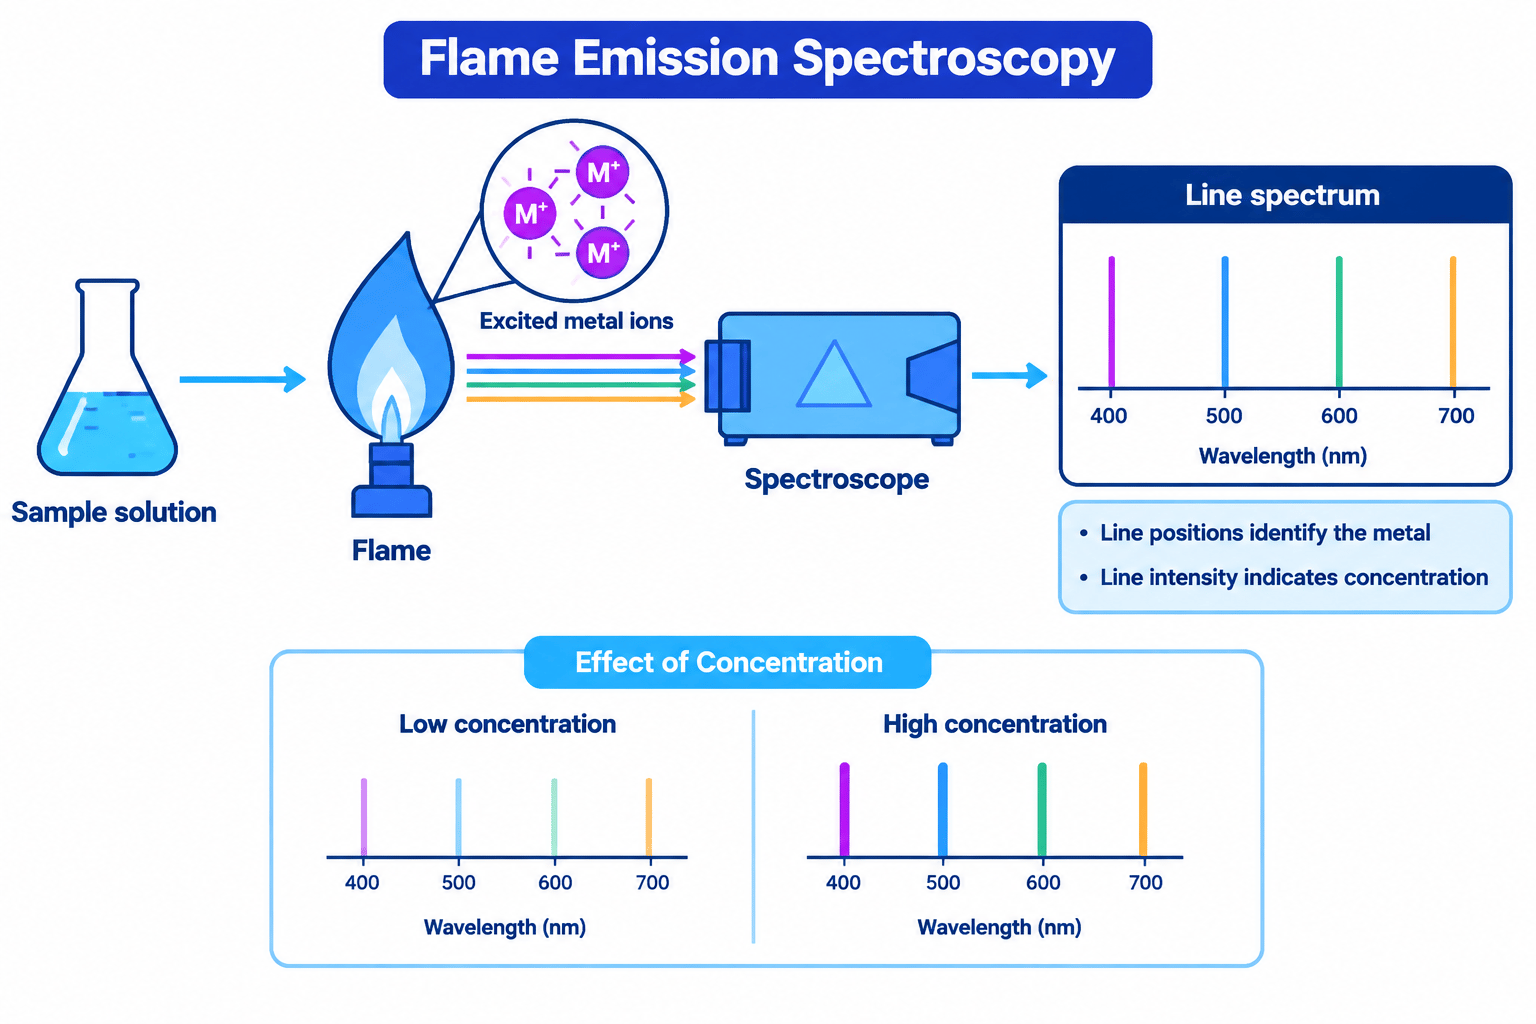
The basic sequence is: sample solution → flame → emitted light → spectroscope → line spectrum.

Labelled schematic of flame emission spectroscopy showing sample, flame, emitted light, spectroscope and line spectrum

Step-by-step method

  1. A solution containing metal ions is introduced into a flame, often as a fine spray.
  2. The flame transfers energy to the metal ions.
  3. The ions emit light at specific wavelengths.
  4. The light passes through a spectroscope.
  5. The output is a line spectrum.
  6. The line spectrum is compared with reference spectra to identify the metal ions.

In class, you may observe flame spectra using a hand-held spectroscope. You are not expected to memorise every possible line pattern, but you do need to understand how to compare an unknown result with reference data.

Identifying metal ions from a line spectrum

To identify a metal ion, compare the positions of the lines in the unknown spectrum with the positions of lines in reference spectra.

The line position is linked to wavelength. If the wavelengths match, the ion is likely to be present.

Tip

Identity comes from position

Use the wavelengths of the lines to identify the ion. The intensity of the lines is mainly used to judge how much of the ion is present.

Mixtures of ions

If a solution contains more than one metal ion, the line spectrum may contain lines from each ion. This means the unknown spectrum can look like a combination of two or more reference spectra.

Diagram showing reference line spectra, an unknown sample matched to ions, and a calibration graph using intensity to find concentration

Example

Identifying ions from wavelengths

An unknown solution gives lines at 589 nm, 766 nm and 770 nm.

Reference data:

Metal ionMain emission wavelengths in nm
Lithium, Li⁺671
Sodium, Na⁺589
Potassium, K⁺766, 770
Calcium, Ca²⁺622

Which metal ions are present?

  1. Compare the unknown line at 589 nm with the reference data. It matches sodium, Na⁺, so sodium ions are present.
  2. Compare the unknown lines at 766 nm and 770 nm. These both match potassium, K⁺, so potassium ions are present.
  3. Check whether any other reference wavelengths match the unknown data. There is no line at 671 nm or 622 nm, so lithium and calcium are not supported by the data.

The unknown solution contains sodium ions, Na⁺(aq), and potassium ions, K⁺(aq).

Common Mistake

Matching colours instead of wavelengths

Do not rely on colour names such as “yellow” or “lilac” if the exam gives wavelengths. Use the numerical wavelength data because it is more precise.

Measuring concentration

Flame emission spectroscopy can also be used to measure the concentration of metal ions in a solution.

Definition

Concentration

Concentration is the amount of substance dissolved in a certain volume of solution. In this topic it is commonly measured in moles per cubic decimetre, written as mol/dm³ or mol dm−3\text{mol dm}^{-3}mol dm−3.

A more concentrated solution contains more of the metal ion in the same volume. This usually produces a stronger emission signal, so the line has a greater intensity.

Definition

Intensity

Intensity is a measure of how strong the emitted light signal is at a particular wavelength.

To find concentration, scientists use standard solutions.

Definition

Standard solution

A standard solution is a solution with a known concentration.

The instrument measures the emission intensity for several standard solutions. These results are used to make a calibration curve.

Definition

Calibration curve

A calibration curve is a graph made using known concentrations and their measured intensities, so the concentration of an unknown sample can be found.

Using a calibration curve

A typical calibration graph has:

  • Concentration on the x-axis.
  • Emission intensity on the y-axis.
  • A line or curve showing how intensity changes with concentration.

For many GCSE questions, the graph is a straight line over the range being used. If the unknown sample gives a certain intensity, you read across to the line, then down to the concentration axis.

Example

Finding concentration from intensity

A sodium ion calibration graph is a straight line through the origin. A standard solution with concentration 0.0040 mol/dm³ gives an intensity of 80. An unknown sodium ion solution gives an intensity of 50.

Find the concentration of the unknown solution.

  1. Since the graph is a straight line through the origin, intensity is directly proportional to concentration. So the fraction of the standard intensity is 5080\frac{50}{80}8050​.
  2. Apply the same fraction to the standard concentration:
cunknown=5080×0.0040 c_{\text{unknown}} = \frac{50}{80} \times 0.0040 cunknown​=8050​×0.0040
  1. Calculate the concentration:
cunknown=0.0025 mol dm−3 c_{\text{unknown}} = 0.0025\ \text{mol dm}^{-3} cunknown​=0.0025 mol dm−3

The unknown sodium ion concentration is 0.0025 mol/dm³.

Common Mistake

Only use proportionality when justified

You can only calculate by direct proportion if the calibration graph is straight and passes through the origin. If the exam gives a curve, read from the graph instead.

What the output might look like in an exam

You may be given flame emission spectroscopy data as:

  • A line spectrum diagram.
  • A graph of intensity against wavelength.
  • A table of wavelengths.
  • A calibration graph.
  • A table of concentration and intensity values.

The key skill is to compare the unknown result with the reference set in the same form.

Spectrum as a graph

Sometimes a line spectrum is shown as a graph with sharp peaks. The x-axis shows wavelength and the y-axis shows intensity.

For identification, match the x-values of the peaks. For concentration, use the height or intensity of the peak, usually at one chosen wavelength.

Key Idea

Position vs height

Peak position tells you which ion is present. Peak height or intensity helps you find how much of that ion is present.

Advantages and limitations

Advantages

Flame emission spectroscopy is useful because it can:

  • Identify metal ions in solution.
  • Detect low concentrations.
  • Analyse mixtures of metal ions.
  • Give numerical concentration data.
  • Avoid relying only on visible flame colour.

Limitations

It does not identify every possible ion in Chemistry GCSE. This topic is about metal ions in solutions. The instrument also needs calibration, clean equipment and suitable reference data.

Contamination can be a problem. For example, sodium compounds are common and can produce a strong yellow emission, so equipment must be clean.

Common Mistake

Forgetting contamination

If an unexpected sodium line appears, it may be due to contamination rather than sodium being deliberately present in the sample.

Comparing with simple flame tests

A simple flame test might tell you that a flame looks yellow. Flame emission spectroscopy can show a sharp line at a particular wavelength, such as around 589 nm for sodium.

So, flame emission spectroscopy is like a more precise, measurable version of the flame test.

Tip

Easy comparison phrase

A good exam phrase is: flame emission spectroscopy gives a line spectrum that can be compared with reference spectra to identify metal ions.

Exam technique

In the exam

  1. Match unknown line positions or peak wavelengths with the reference data to identify the metal ion.
  2. Use intensity, not wavelength, when the question asks for concentration.
  3. If given a calibration graph, read across from the unknown intensity to the line, then down to the concentration axis.
Self review

Check yourself

  • What does a spectroscope do in flame emission spectroscopy?
  • Why do different metal ions produce different line spectra?
  • How would you use a calibration graph to find the concentration of an unknown sample?

Identification of ions by chemical and spectroscopic means (chemistry only)

Guide 7 of 7

You've reached the end

Test yourself on this topic, or move on to the next guide.

Next guideThe proportions of different gases in the atmosphereStart

How was this guide?

Flame emission spectroscopy Revision Guide

  1. GCSE
  2. /Chemistry
  3. /Flame emission spectroscopy