What a market map is: two axes and one dot for every rival
Definition
Market map: a grid that plots the products in a market against two features customers care about, one feature on each axis, also called a positioning map.
- A market map is a grid: one feature runs left to right along the horizontal axis, a second runs bottom to top along the vertical axis, and a line drawn through the middle of each splits the grid into four quarters.
- Each axis needs an opposite at either end, so that any product can be placed somewhere between them.
- Price: low price at the left-hand end of the horizontal axis, high price at the right-hand end.
- Quality: basic at the bottom of the vertical axis, premium at the top.
- Any other pair customers care about: traditional against modern, plain against heavily branded, or narrow range against wide range.
- You then mark each competing product as a labelled dot, placed by where customers think it sits on those two features, not by where the owner would like it to sit.
Example
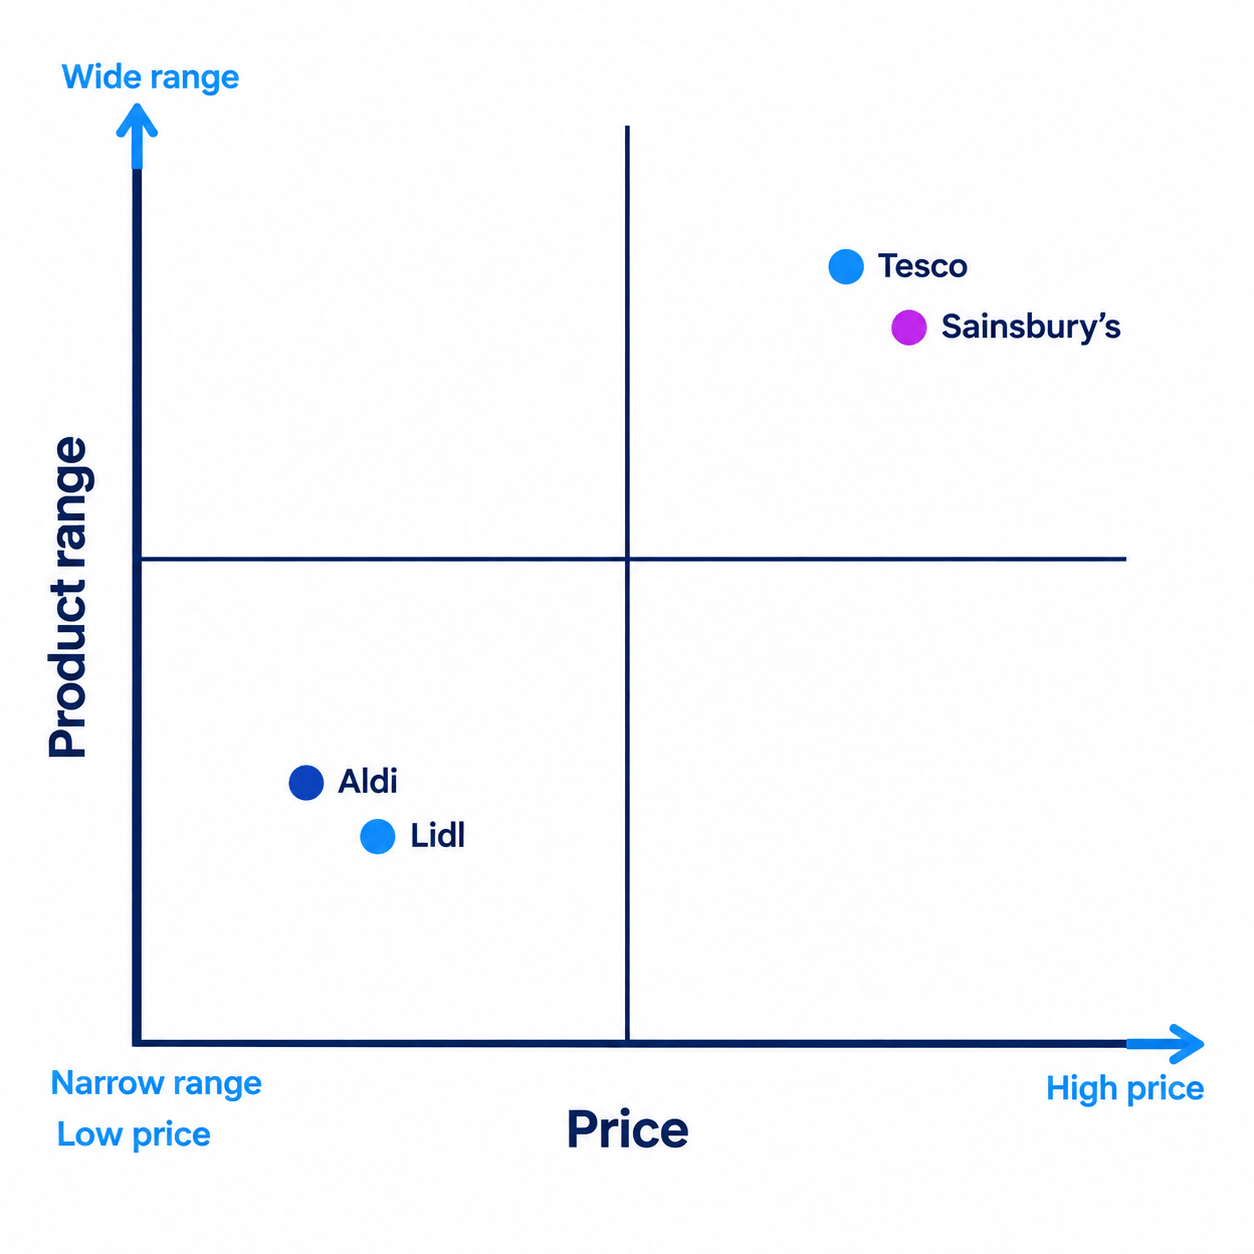
- Map the UK supermarkets with price from low on the left to high on the right, and product range from narrow at the bottom to wide at the top.
- Aldi and Lidl sit low and near the bottom, because they compete on price with a narrower range.
- Tesco and Sainsbury's sit further right and near the top, with higher prices, a wider range and click and collect.
- The two pairs land in different quarters, so they are chasing shoppers who want different things rather than fighting over the same one.
Reading the map: clusters show competition, empty space suggests a gap
Definition
Gap in the market: a position on the map where customers might want a product but no competitor is currently selling one.
- A cluster, meaning several dots bunched close together, marks the part of the market where competition is fiercest.
- Launching into a cluster means taking customers away from rivals those customers already know, which usually forces a lower price or heavier spending on promotion, so the profit on each sale is squeezed.
- An empty space is a possible gap in the market, because no product on the grid currently offers that combination of the two features.
- A business that moves into an empty space has no direct rival beside it, so it can set its own price rather than match one, and it becomes the obvious choice for anyone who wants that combination.
What a business does with the map
- The finished map supports three decisions.
- Position a new product: aim the price, packaging and promotion at an empty space, so the product is different from the day it launches rather than a copy of something already selling.
- Identify who the real rivals are: the nearest dots are the firms competing for the same customers, which is often a shorter list than every business in the industry.
- Check its own dot: a business sitting on top of a larger competitor is fighting a firm with a better-known name and deeper pockets, so it may reposition to a quieter part of the grid.
- PureGym sits at low monthly membership with 24-hour access and no staffed reception, which keeps it clear of gyms selling on service and facilities, so it wins members on price instead of competing on something rivals already do better.
Note
- A map shows where a rival sits, not how strong it is.
- Judging what competitors do well and badly is covered in 1.2.4a.
Limits of the map: an empty space is a question, not an answer
- A space may be empty because nobody wants that combination, which is why high price with basic quality is bare on almost every map ever drawn.
- The grid shows only the two features you chose, so a product that wins on service, delivery speed or brand image can look identical to a rival on your axes while feeling completely different to a shopper.
- Where you plot a rival is partly opinion, because words such as premium have no measurement, so two people mapping the same market can produce two different maps.
- The map carries no numbers, so a gap has to be tested with market research before any money is spent, because the grid cannot tell you how many customers sit in that space or what they would pay.
Exam technique
- Name the two features on the axes before you comment on anything, because the application marks depend on using that market's axes rather than a memorised price against quality map.
- If the paper prints a map, quote real positions and name the brands, for example that three rivals cluster at low price.
- Carry the chain through: name the gap, say what product would fill it, then say why customers in that space would buy it.
- Where the question asks whether the business should fill the gap, add that the space may be empty because demand there is too small, and recommend market research first.
Self review
- What do the two axes on a market map show?
- Define a gap in the market.
- What does a cluster of brands tell you about competition in that part of the market?
- Give two reasons why an empty space on a map might not be worth filling.
- Why can two people mapping the same market end up with different maps?