Drawing the chart: three lines on one pair of axes
Definition
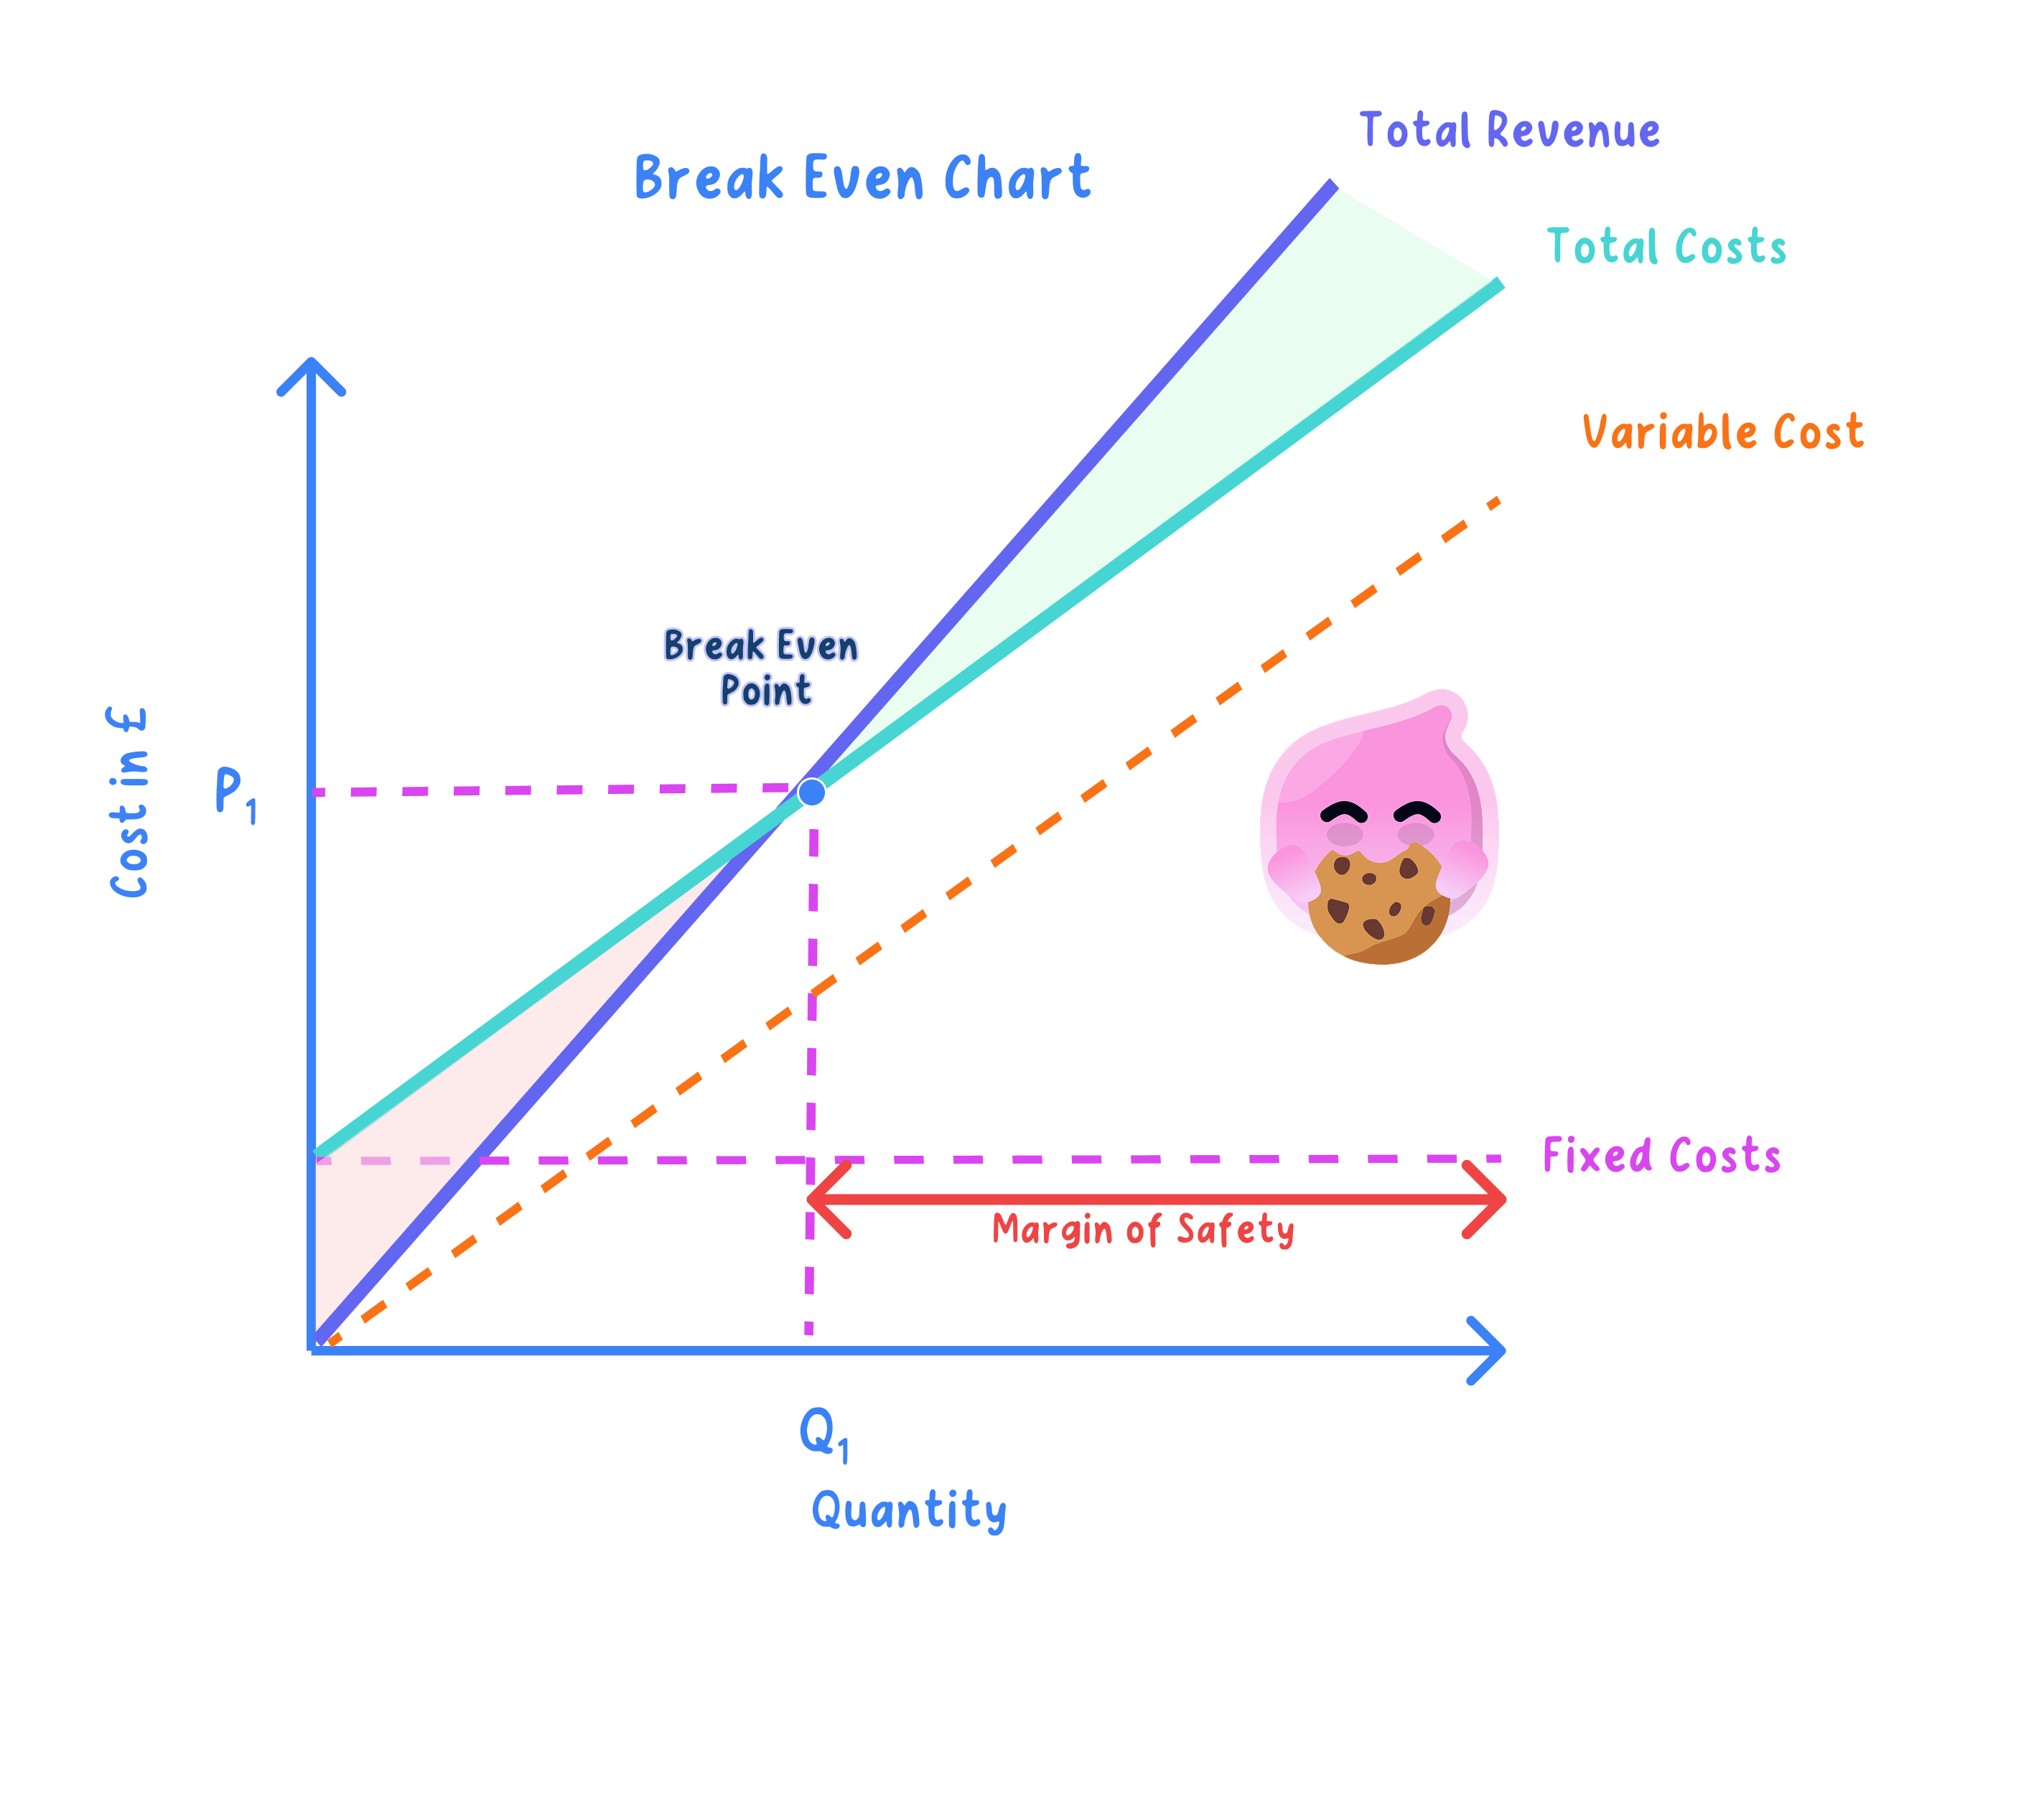
Break-even chart: a graph plotting fixed costs, total costs and total revenue against output, so the break-even level of output and the size of any profit or loss can be read straight off the diagram.
- The horizontal axis measures output in units and the vertical axis measures money in £, so every point on the chart pairs a level of output with an amount of money.
- Three lines sit on those axes, and each has a shape you have to get right.
- Fixed costs: a horizontal line, because rent, insurance and salaries are the same whether the business makes nothing or 2,000 units.
- Total costs: a line that meets the vertical axis level with fixed costs and then slopes upwards, because the variable cost of each extra unit is added on top of the fixed costs.
- Total revenue: a line from the origin that slopes up more steeply than total cost while the product is profitable, because at zero output there is nothing sold and no money coming in.
- Draw them in that order, since the total cost line has to start level with the fixed cost line and can never fall below it.
Common Mistake
- The most common error is drawing the total cost line flat, which just repeats the fixed cost line under a new label.
- Total cost must slope up, because every extra unit made adds its variable cost.
- The revenue line starts at the origin, not level with fixed costs, because a business with no sales takes no money.
- Profit is the vertical gap between total revenue and total cost, never the gap between revenue and the fixed cost line.
Reading the chart: break-even output, profit, loss and the margin of safety
- The two sloping lines cross at one output only, and reading down from that crossing to the horizontal axis gives the break even level of output.
- Take a market stall selling phone cases at £9 with a variable cost of £4 each and fixed costs of £4,500, where the lines cross at 900 cases.
- Check the crossing both ways: 900×£9=£8,100900 \times \pounds 9 = \pounds 8{,}100900×£9=£8,100 and £4,500+(900×£4)=£8,100\pounds 4{,}500 + (900 \times \pounds 4) = \pounds 8{,}100£4,500+(900×£4)=£8,100.
- Because the two figures match at £8,100, the stallholder covers every cost at 900 cases and takes nothing home, so case 901 is the first one that adds profit.
- To the left of the crossing the total cost line sits above the revenue line and the vertical gap between them is the loss, so at 600 cases revenue of £5,400 against costs of £6,900 leaves a loss of £1,500.
- To the right the revenue line is on top and the same vertical gap is the profit, so at 1,300 cases revenue of £11,700 against costs of £9,700 gives a profit of £2,000.
- The margin of safety is the horizontal distance from break-even output back to actual output, so selling 1,300 cases gives 400 cases of cushion before the stall drops into loss.
Example
- Greggs sells cheap hot food, so each sausage roll adds only a small amount to the revenue line.
- A shallow revenue line takes longer to climb up to the total cost line, so break-even output for a shop is counted in thousands of items rather than hundreds.
- Past that output the gap between the two lines widens with every extra item sold, which is why high volume matters so much to a low-price business.
- A quiet week that pushes sales back towards the crossing point wipes out the margin of safety fast.
The impact of changes in revenue and costs: which line moves
- The chart earns its keep when a figure changes, because you can see which line moves and which way the crossing point slides before you work out a single number.
- Fixed costs rise: the fixed cost line and the total cost line both shift up in parallel, the lines cross further to the right, so break-even output rises and the margin of safety falls.
- Variable cost per unit rises: the total cost line starts from the same point on the vertical axis but becomes steeper, so the crossing moves right and break-even output rises.
- Selling price rises: the revenue line becomes steeper and meets the cost line sooner, so break-even output falls and the margin of safety grows.
- Selling price falls, perhaps through a discount: the revenue line flattens, the crossing moves right and break-even output rises.
- Carry the shift through to the business: an extra £900 of rent lifts the stall's fixed costs to £5,400, which pushes break-even output to 1,080 cases.
- That means 180 more cases must be sold before any profit appears, and at an output of 1,300 the margin of safety shrinks from 400 cases to 220, so the owner is trading much closer to a loss than before.
Exam technique
- Label both axes and all three lines, because a correctly shaped diagram scores nothing if the marker cannot tell which line is which.
- To read break-even output, drop a dotted line from the crossing point to the output axis and write the answer in units.
- When a question changes a price or a cost, redraw only the line that moves, mark the new crossing point and state whether break-even output has risen or fallen.
- Finish by saying what the new figure means for the business, such as how many more units it must sell each week to stay out of loss.
Self review
- Why is the fixed cost line horizontal?
- Where does the total cost line meet the vertical axis, and why is it not at the origin?
- A stall has fixed costs of £4,500, a price of £9 and a variable cost of £4 per case: what is the loss at an output of 600 cases?
- Which line moves, and in which direction, when the variable cost per unit rises?
- What happens to the margin of safety when fixed costs rise and output stays the same?
