Type 1 diabetes produces too little insulin
Type 1 diabetes
A condition in which the pancreas produces little or no insulin, so blood glucose concentration cannot be reduced effectively.
- Type 1 diabetes occurs when the pancreas produces little or no insulin.
- Without enough insulin body cells take in less glucose and the liver converts less glucose into glycogen.
- Blood glucose remains too high especially after carbohydrate is digested and glucose enters the blood.
- Control requires insulin delivered by injection or a pump because swallowing insulin would expose this protein hormone to digestive enzymes.
- Dose and timing must be matched to food intake, activity and the measured blood glucose concentration.
- Regular monitoring helps prevent blood glucose becoming dangerously high or falling too low after too much insulin.
Type 2 diabetes reduces insulin response
Type 2 diabetes
A condition in which body cells respond less effectively to insulin, so blood glucose concentration remains too high.
- Type 2 diabetes occurs when body cells respond less effectively to insulin.
- The pancreas can still make insulin but glucose uptake and glycogen formation do not increase enough.
- Blood glucose remains high because glucose is removed from the blood more slowly.
- Control often begins with lifestyle changes including a controlled carbohydrate intake, regular exercise and loss of excess body mass.
- Medication may be needed when lifestyle changes do not control blood glucose adequately.
- Risk is influenced by several factors including excess body fat, physical inactivity and inherited variation.
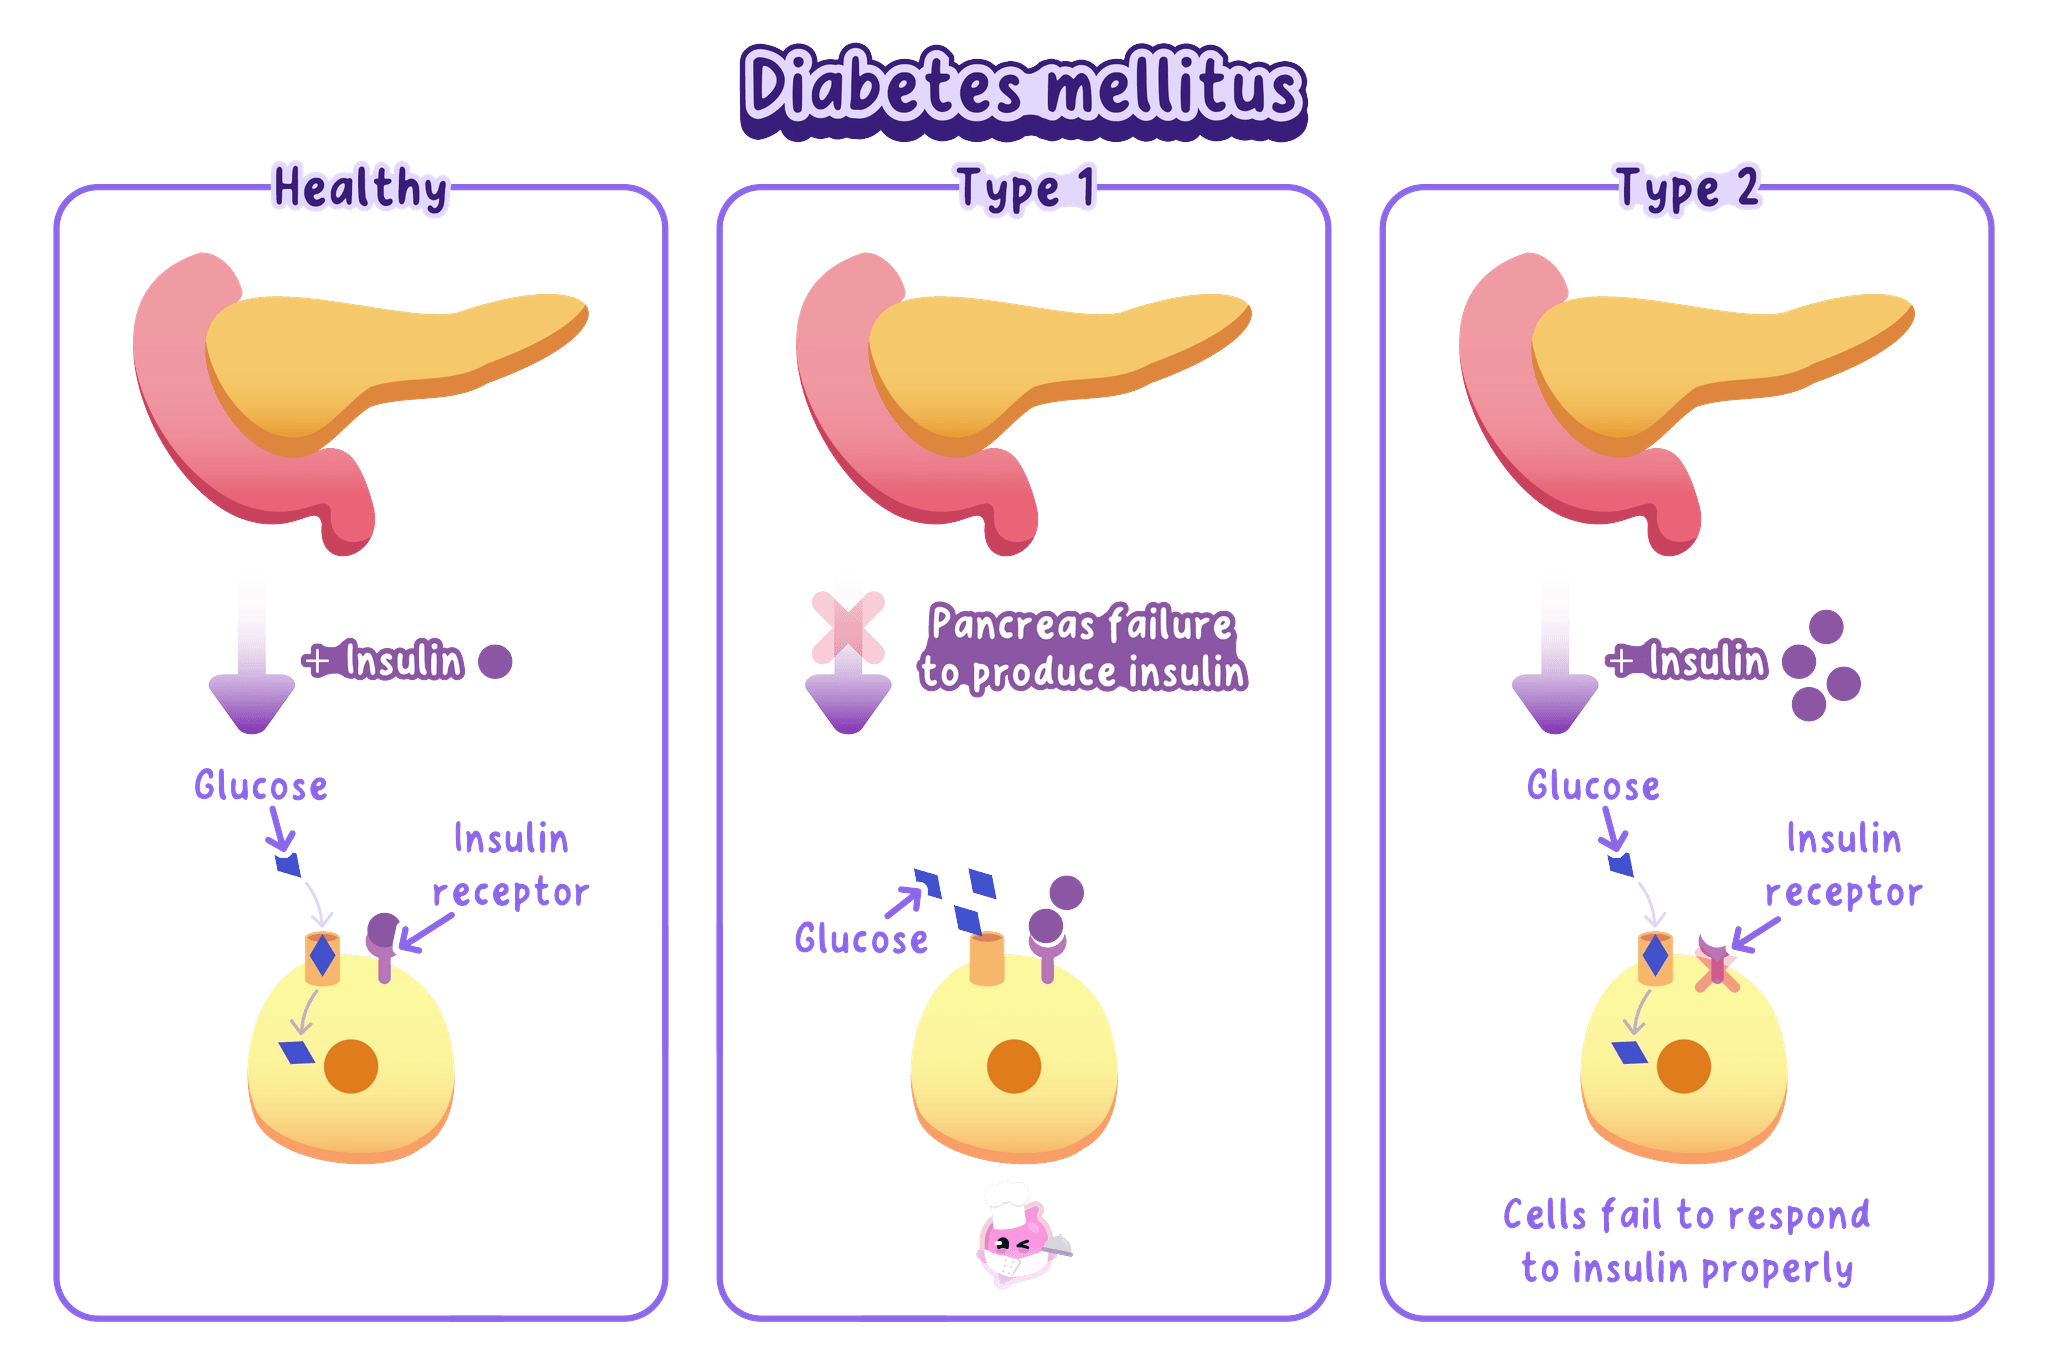
Do not describe type 2 diabetes as a failure to make any insulin, because its defining problem is a reduced response of target cells to insulin.
BMI relates mass to height
Body mass index (BMI)
A measure that relates body mass to height, calculated using BMI=mass (kg)[height (m)]2\mathrm{BMI}=\dfrac{\mathrm{mass\ (kg)}}{[\mathrm{height\ (m)}]^2}BMI=[height (m)]2mass (kg).
- Body mass index is calculated using BMI=mass (kg)[height (m)]2\mathrm{BMI}=\dfrac{\mathrm{mass\ (kg)}}{[\mathrm{height\ (m)}]^2}BMI=[height (m)]2mass (kg).
- Mass must be in kilograms and height must be in metres before the values are substituted.
- BMI estimates weight category but it does not distinguish between muscle mass and body fat.
Waist-to-hip ratio estimates fat distribution
Waist-to-hip ratio
The waist circumference divided by the hip circumference, measured in the same units.
- Waist-to-hip ratio is calculated using waist:hip ratio=waist circumferencehip circumference\mathrm{waist{:}hip\ ratio}=\dfrac{\mathrm{waist\ circumference}}{\mathrm{hip\ circumference}}waist:hip ratio=hip circumferencewaist circumference.
- Both circumferences need the same unit so centimetres divided by centimetres gives a ratio with no unit.
- A larger ratio indicates that more body mass is carried around the abdomen and is associated with a greater risk of type 2 diabetes.
Calculating two body measurements
- BMI data: a person has a mass of 72 kg72\,\mathrm{kg}72kg and a height of 1.80 m1.80\,\mathrm{m}1.80m.
- BMI calculation: BMI=72(1.80)2=22.2 kg m−2\mathrm{BMI}=\dfrac{72}{(1.80)^2}=22.2\,\mathrm{kg\,m^{-2}}BMI=(1.80)272=22.2kgm−2 to three significant figures.
- Ratio data: the same person has a waist circumference of 84 cm84\,\mathrm{cm}84cm and a hip circumference of 100 cm100\,\mathrm{cm}100cm.
- Ratio calculation: waist:hip ratio=84100=0.84\mathrm{waist{:}hip\ ratio}=\dfrac{84}{100}=0.84waist:hip ratio=10084=0.84.
- Interpretation: the measurements describe body size and fat distribution, so they estimate risk rather than diagnose diabetes.
Correlation does not prove cause
Correlation
A relationship in which two variables change together in a pattern, which does not by itself show that one variable causes the other.
- A positive correlation exists when the incidence of type 2 diabetes tends to increase as body mass or waist-to-hip ratio increases.
- Correlation is evidence of an association but it does not show by itself that increased body mass directly caused diabetes in every person.
- Other variables such as diet, physical activity, age and inherited variation may affect both body mass and diabetes risk.
- Evaluation should consider the trend, the amount of variation, the sample size and whether important variables were controlled.
Evaluating diabetes risk data
- Describe the pattern: state the direction of the correlation and support it with values from the data.
- Avoid a causal claim: use increases risk or is associated with rather than always causes.
- Identify a limitation: BMI may be high because of muscle, and another variable may explain part of the pattern.
- Reach a measured judgement: the data can support a link without proving that body mass is the only cause.
A glucose test can model urine screening
- Glucose in urine may indicate that blood glucose has been high enough for glucose to remain in the filtrate instead of all being reabsorbed.
- A chemical test can compare simulated urine samples for reducing sugar without handling human body fluid.
Testing simulated urine for glucose
- Aim: compare simulated urine samples for reducing sugar using Benedict's solution.
- Apparatus: labelled simulated urine samples, distilled water, glucose solution, test tubes and rack, pipettes, measuring cylinder, Benedict's solution, a 707070 to 80 ∘C80\,^{\circ}\mathrm{C}80∘C water bath, timer, test-tube holder and eye protection.
- Method:
- Label one tube for each sample, one distilled-water negative control and one glucose positive control
- add 2 cm32\,\mathrm{cm^3}2cm3 of the correct liquid to each tube with clean equipment
- add 2 cm32\,\mathrm{cm^3}2cm3 of Benedict's solution
- place every tube in the water bath for about 5 min5\,\mathrm{min}5min
- remove the tubes with a holder and record the final colour; 6) repeat each sample and compare the results
- Variables: change the simulated urine sample, measure the final colour, and keep the sample volume, Benedict's volume, heating time and water-bath temperature constant.
- Results: a blue result is negative, while green, yellow, orange or brick-red shows an increasing concentration of reducing sugar.
- Controls: distilled water should remain blue and the glucose solution should change colour, showing that the method can distinguish a negative result from a positive result.
- Watch out: use a clean pipette for every liquid because glucose carried between tubes can produce a convincing false positive.
- Safety: wear eye protection because Benedict's solution is an irritant, use a water bath rather than a flame, and handle hot glassware with a test-tube holder.
The result supports a diagnosis, not proves it
- A positive simulated result shows that reducing sugar is present in that sample.
- A real screening result would need confirmation with controlled blood glucose measurements and clinical assessment.
- The strongest comparison links the result to insulin action while recognising that one observation does not identify the diabetes type.
- What causes type 1 diabetes?
- What causes type 2 diabetes?
- How is each type controlled?
- How are BMI and waist-to-hip ratio calculated?
- Why does a correlation between body mass and type 2 diabetes not prove causation?
