Temperature and enzyme activity
Optimum
The temperature or pH at which an enzyme catalyses its reaction fastest.
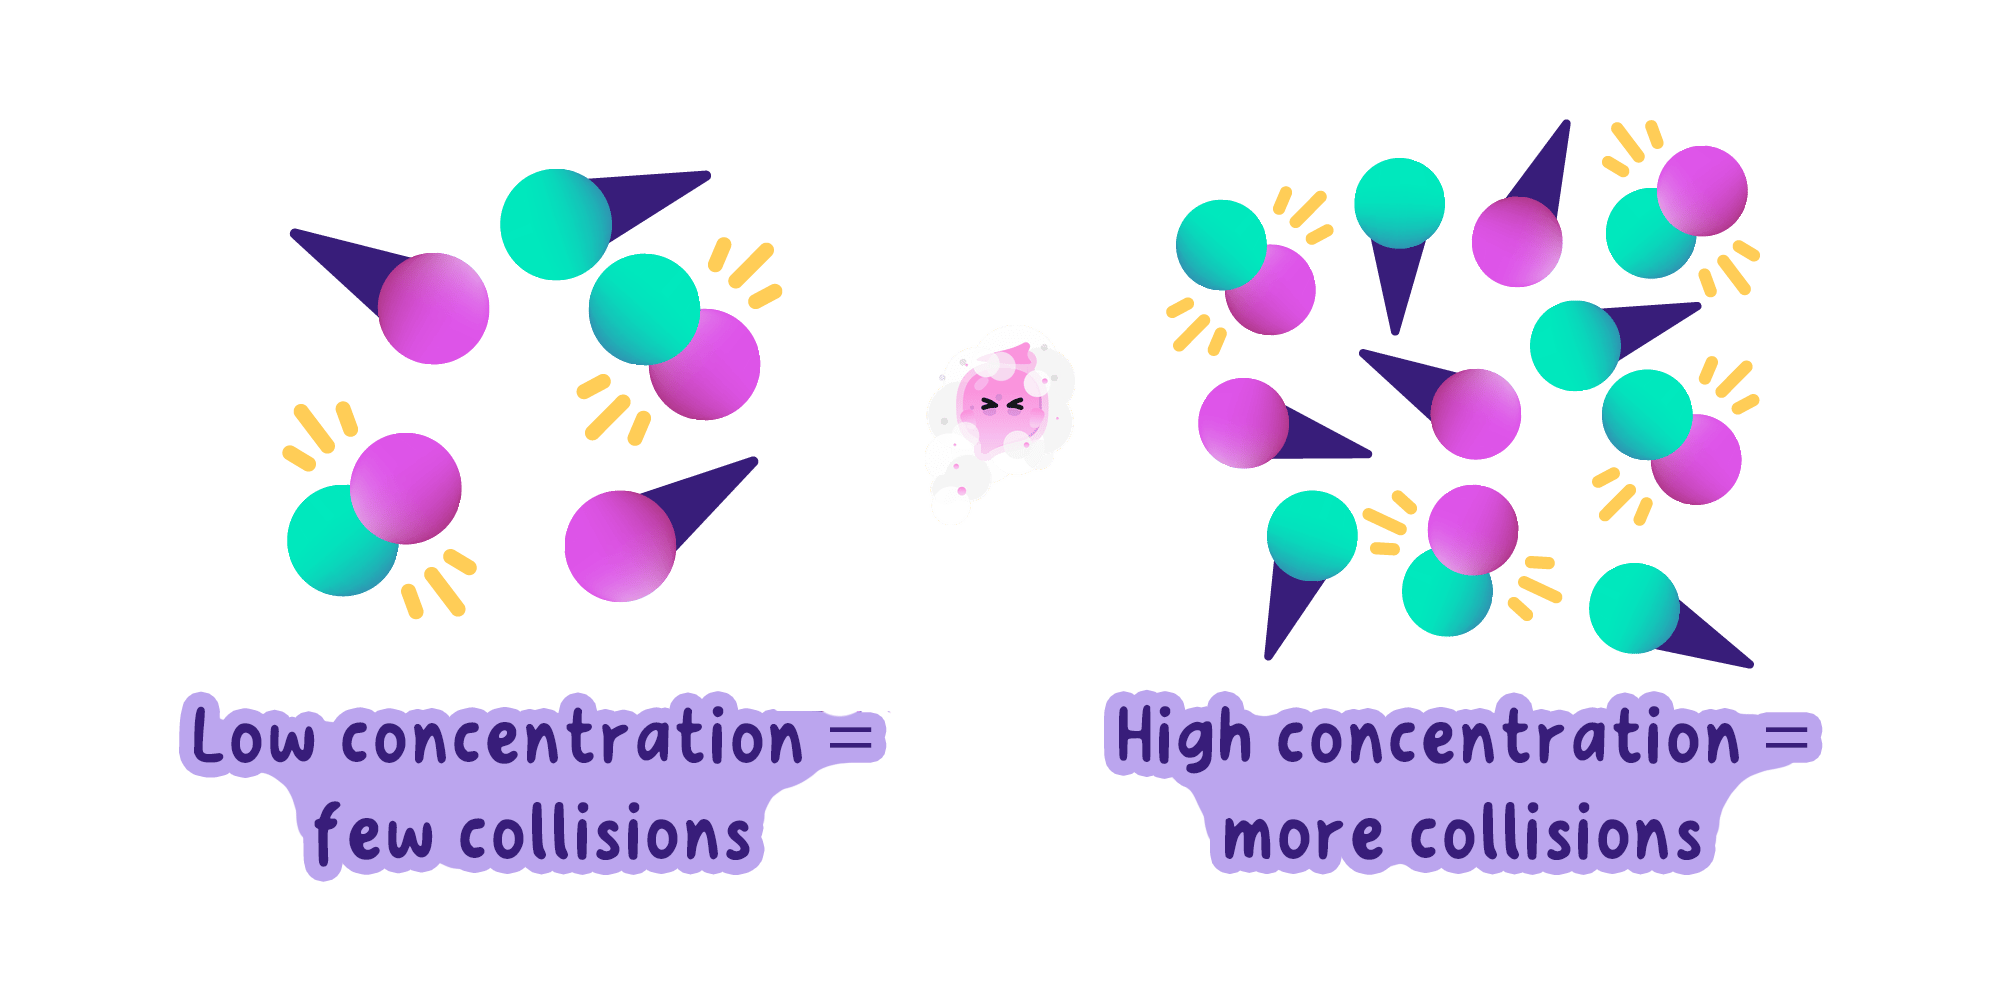
- Warming a mixture gives both the enzyme and the substrate more kinetic energy, so the molecules move faster.
- Faster movement means more successful collisions between substrate molecules and active sites every second.
- More enzyme-substrate complexes form per second, so the rate of reaction rises.
- The rate keeps climbing until the optimum temperature, which is about 37 ∘C37\,^{\circ}\text{C}37∘C for most human enzymes.
- Above the optimum the enzyme is denatured, the active site changes shape, and the rate falls steeply to zero.
- Enzymes from other organisms have different optima, so bacteria living in hot springs have enzymes that work well above 70 ∘C70\,^{\circ}\text{C}70∘C.
The two halves of a temperature curve have completely different causes, since the rise is about collision frequency and the fall is about the active site being destroyed.
pH and enzyme activity
- Plotting rate against pH gives a peak, because each enzyme has an optimum pH at which its active site is exactly the right shape.
- Moving a little either side of the optimum distorts the active site slightly, so fewer substrate molecules fit and the rate falls.
- Moving far from the optimum breaks the bonds holding the shape altogether, and the enzyme is denatured.
- The optimum matches where the enzyme normally works, so the protease in the acidic stomach peaks near pH 222.
- Salivary amylase peaks close to neutral, and the enzymes in the small intestine work best in slightly alkaline conditions near pH 888.
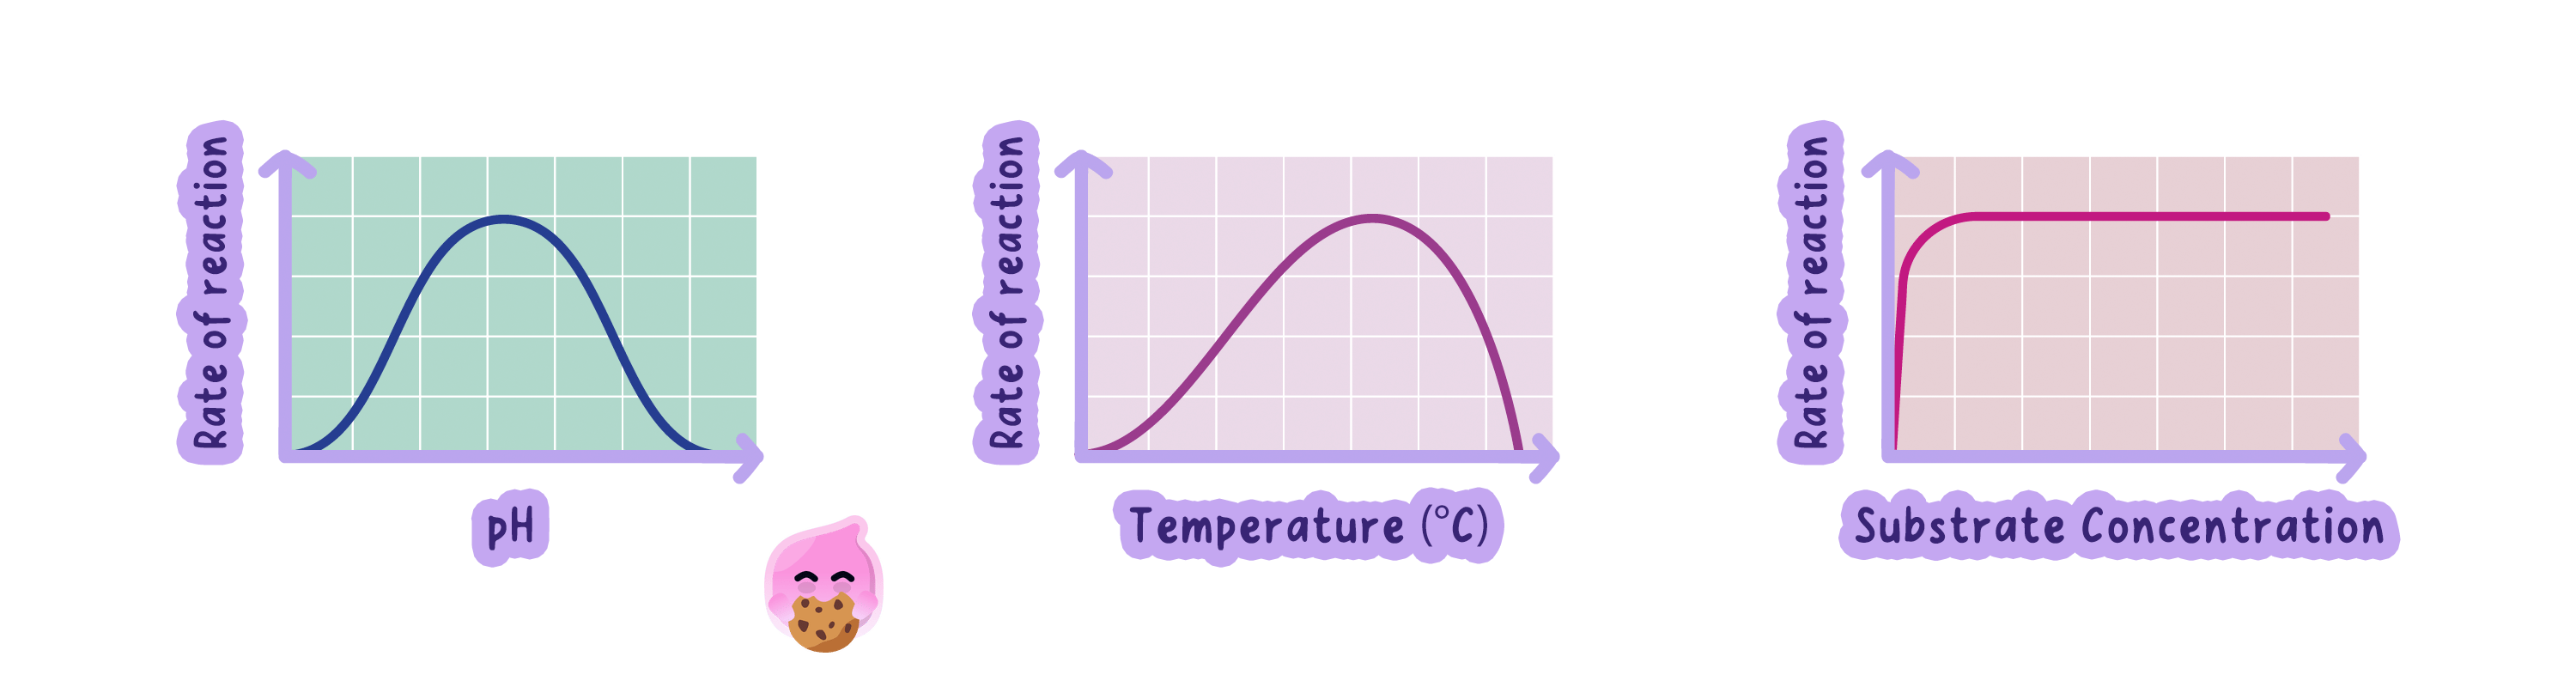
Read the optimum straight off the peak of the curve, and quote it with its unit, so a pH graph peaking at 6.56.56.5 gives an optimum pH of 6.56.56.5.
Substrate concentration and enzyme activity
- At low substrate concentration the rate rises in direct proportion to the amount of substrate added.
- More substrate molecules in the same volume means more collisions with active sites each second, so more complexes form.
- Beyond a certain point the line levels off into a plateau and adding more substrate makes no difference.
- Every active site is already occupied, so the enzyme is described as saturated and the extra substrate has to wait its turn.
- The number of enzyme molecules is what limits the rate once the plateau is reached.
- Adding more enzyme therefore raises the height of the plateau, while adding more substrate does not.
A substrate concentration graph levels off but never falls, so a curve that drops back down is showing denaturation and cannot be a substrate concentration graph.
Calculating a rate
Rate of reaction
The amount of substrate used up, or product formed, in a given time.
- When you can measure how much product forms, divide that amount by the time it took.
- rate=change in quantitytime taken\text{rate} = \dfrac{\text{change in quantity}}{\text{time taken}}rate=time takenchange in quantity
- When you can only time how long a reaction takes to reach an end point, use the reciprocal of the time instead.
- rate=1000time in seconds\text{rate} = \dfrac{1000}{\text{time in seconds}}rate=time in seconds1000
- Multiplying by 100010001000 simply avoids awkward decimals, and the values are treated as arbitrary units.
- A shorter time always means a faster rate, which is the check to run before writing an answer down.
Take a mean of the repeats before calculating a rate, and ignore any anomalous result when working that mean out.
- Starch takes 40 s40\,\text{s}40s to disappear at pH 666, so use the reciprocal form.
- rate=100040=25 arbitrary units\text{rate} = \dfrac{1000}{40} = 25\ \text{arbitrary units}rate=401000=25 arbitrary units
- At pH 444 the same reaction takes 125 s125\,\text{s}125s, giving a rate of 888, so the enzyme works around three times faster at pH 666.
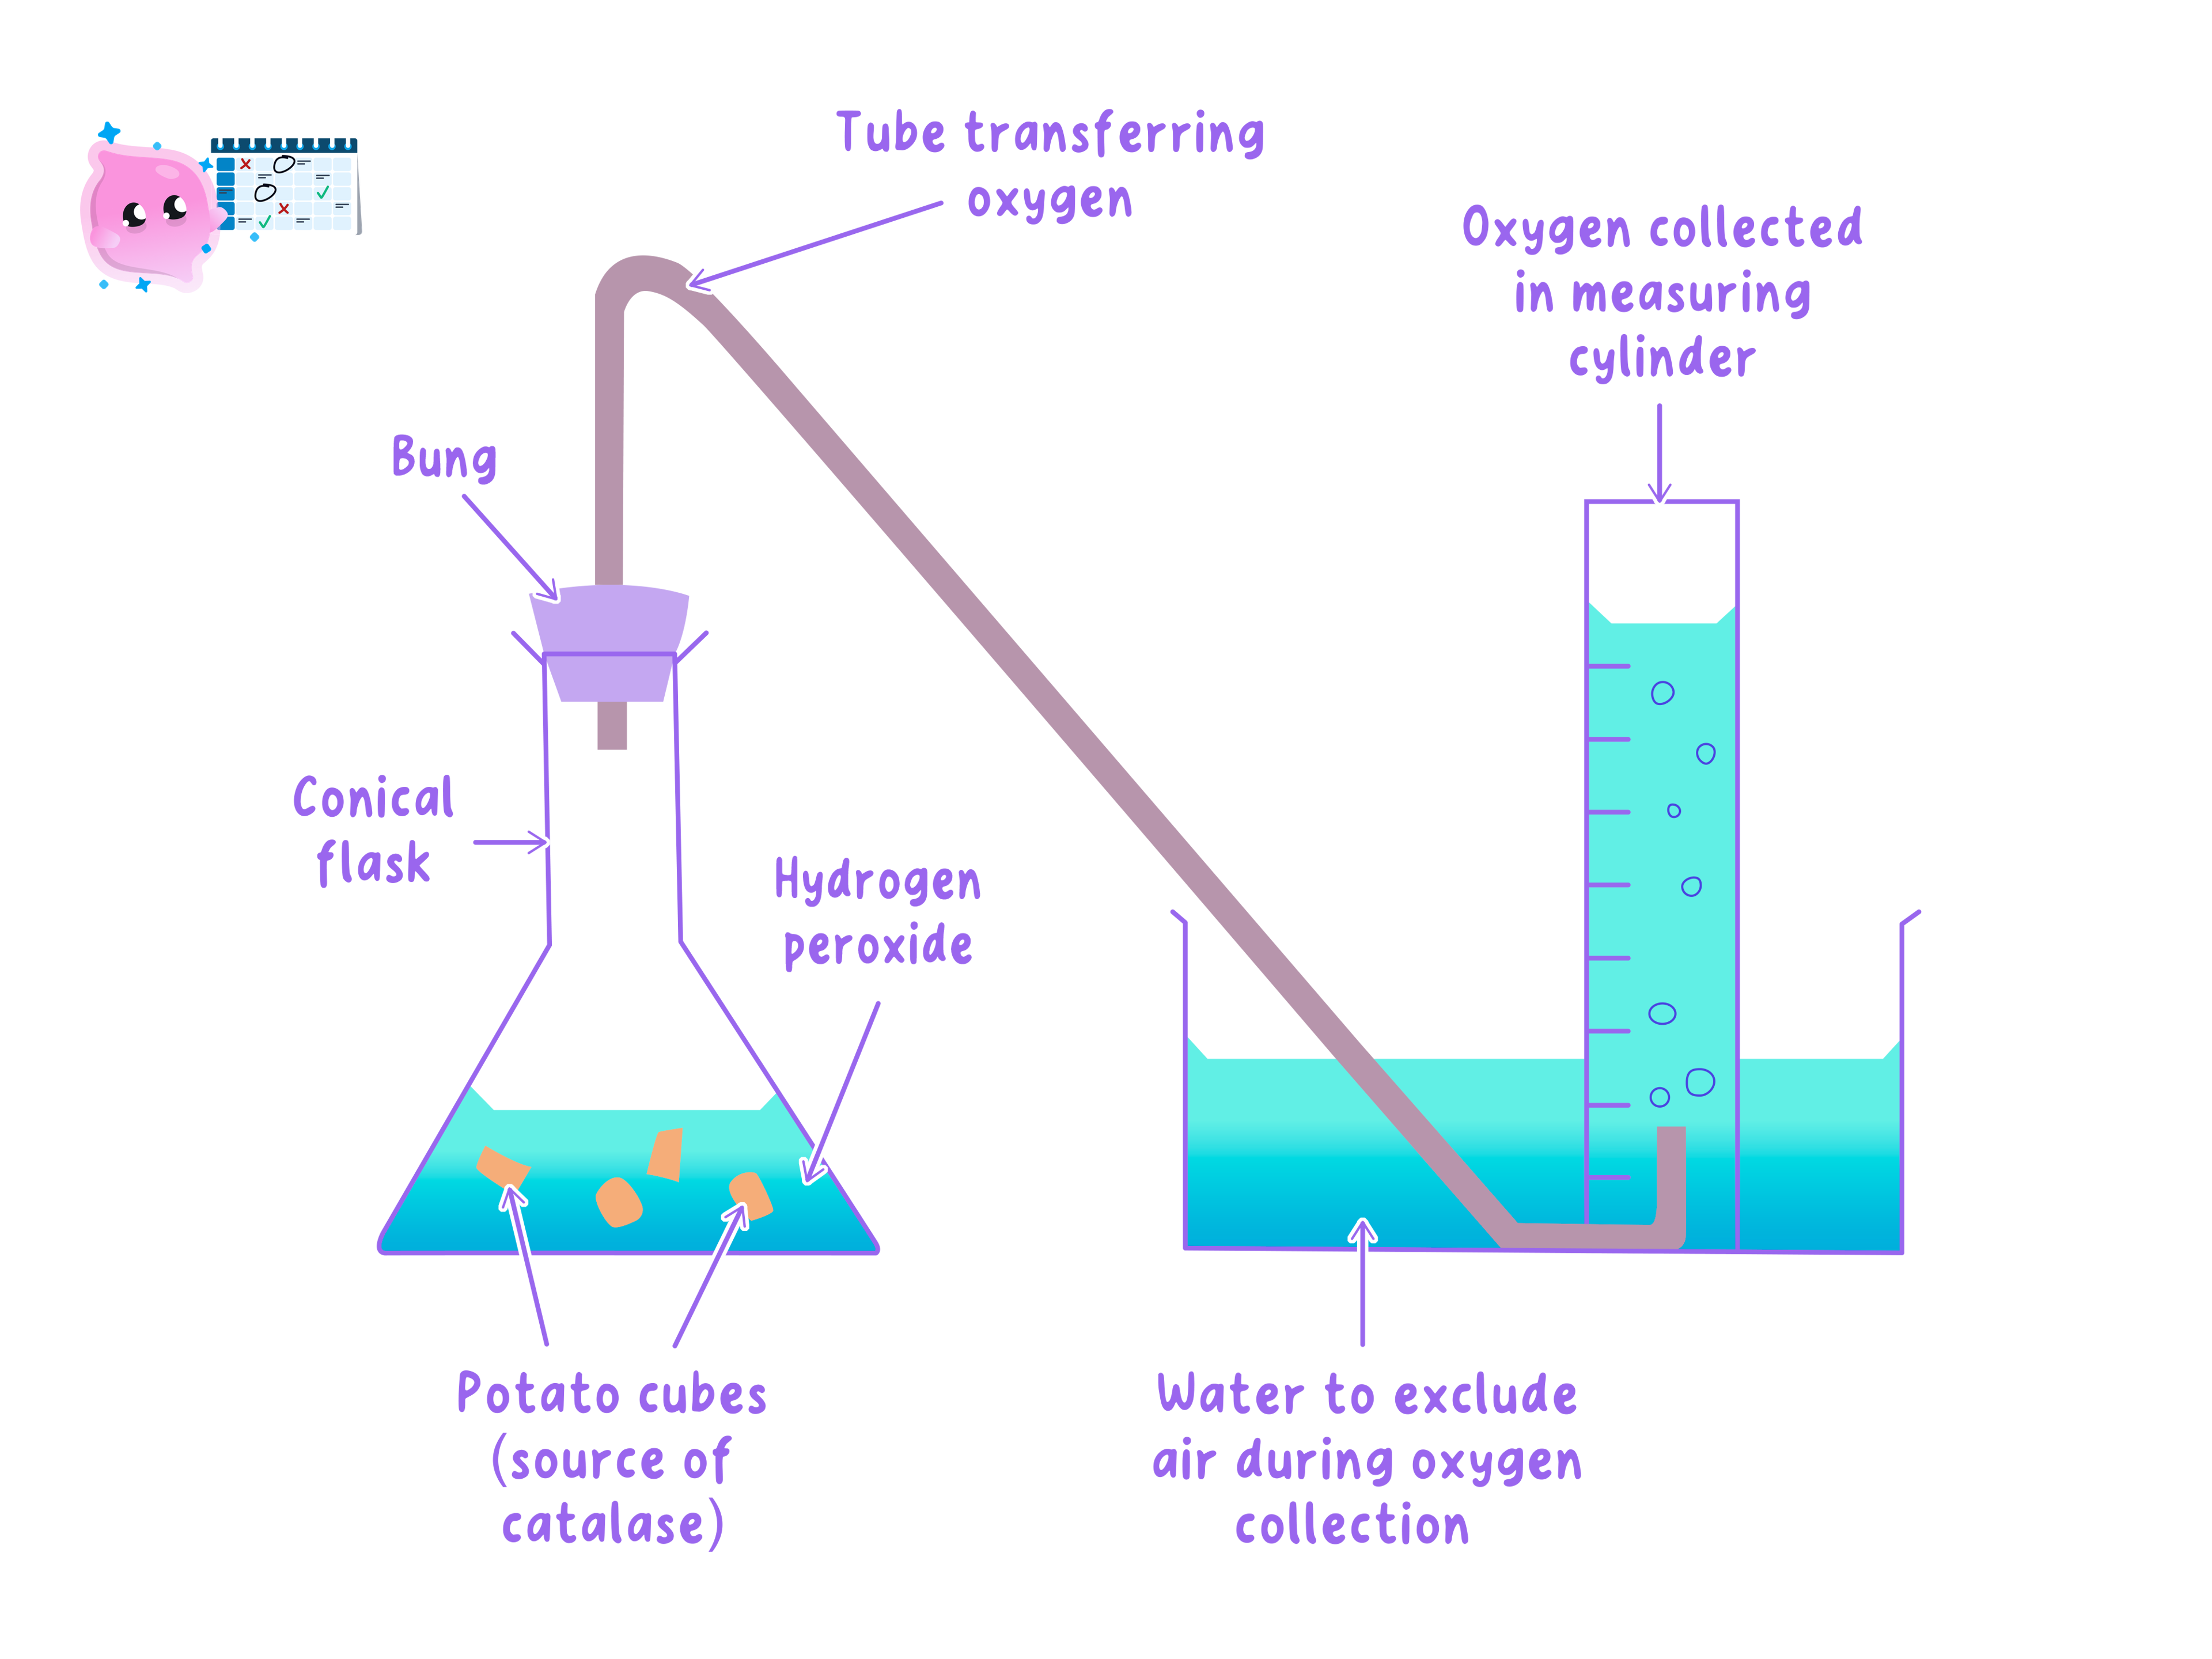
- Catalase releases 24 cm324\,\text{cm}^324cm3 of oxygen in 60 s60\,\text{s}60s, and here you know the quantity, so divide it by the time.
- rate=2460=0.4 cm3/s\text{rate} = \dfrac{24}{60} = 0.4\,\text{cm}^3/\text{s}rate=6024=0.4cm3/s
- Give the unit with the answer whenever the quantity has one, so a gas volume over time is written in cm3/s\text{cm}^3/\text{s}cm3/s.
- Write the equation, then the substitution, then the answer, because the method mark survives an arithmetic slip only if the equation is on the page.
- When a question asks you to explain a rise in rate, name the collisions, because saying only that the particles move faster earns half the credit.
- For a plateau, say that all the active sites are occupied and name enzyme concentration as the factor now limiting the rate.
pH and enzyme activity
- Aim: to find how pH affects how fast amylase breaks starch down, by timing how long the starch takes to disappear.
- Apparatus: spotting tile, 0.01 mol/dm30.01\,\text{mol/dm}^30.01mol/dm3 iodine solution, 1% amylase solution, 1% starch solution, buffer solutions across a pH range, one 5 cm35\,\text{cm}^35cm3 syringe for each solution, stirring rod, test tubes, a water bath at about 30 ∘C30\,^{\circ}\text{C}30∘C, stop clock and eye protection.
- Method:
- Put a drop of iodine solution into every well of the spotting tile.
- Using its own syringe, put 2 cm32\,\text{cm}^32cm3 of amylase into a test tube and add 1 cm31\,\text{cm}^31cm3 of the pH 4 buffer.
- Stand the tube in the 30 ∘C30\,^{\circ}\text{C}30∘C water bath for a few minutes, so it reaches temperature and the pH is already set before the reaction begins.
- Add 2 cm32\,\text{cm}^32cm3 of starch solution, start the clock at that moment, and stir.
- After 10 s10\,\text{s}10s transfer one drop of the mixture into the first well of iodine.
- Repeat every 10 s10\,\text{s}10s into the next well along.
- While starch is present the iodine goes blue-black, and the moment a drop leaves the iodine orange-brown all the starch has been digested, so record that time.
- Repeat at pH 5, 6, 7 and 8, keeping every volume, the temperature and the stirring the same, and do three runs at each pH to take a mean.
- Variables: you change the pH and you measure the time for the starch to disappear, while keeping the temperature, the volume and concentration of amylase and starch, the stirring, the drop size and the sampling interval the same.
- Results: the time is shortest near amylase's optimum of about pH 6 to 7, so the rate is highest there and falls away on both sides, and at an extreme pH some wells stay blue-black for the whole run because the enzyme has been denatured.
- Maths: rate =1000÷= 1000 \div=1000÷ time in seconds, then plot rate against pH and read the optimum off the peak of the curve.
- Watch out: use a separate syringe for every solution because one drop of amylase in the starch bottle spoils the whole class set, start the clock as the starch goes in rather than before, and remember that sampling every 10 s10\,\text{s}10s means the true end point could be up to 10 s10\,\text{s}10s out.
- Safety: wear eye protection because iodine stains and irritates, take care with the hot water bath, and wash your hands afterwards.
- Temperature below the optimum slows an enzyme down but does not denature it, so the effect is reversible.
- A plateau on a substrate concentration graph is caused by saturated active sites, not by denaturation.
- A shorter time means a faster rate, so a graph of time against pH is the mirror image of a graph of rate against pH.
- There is no single optimum shared by all enzymes, so quote the optimum of the enzyme in the question rather than assuming 37 ∘C37\,^{\circ}\text{C}37∘C and pH 777.
- Explain, in terms of collisions, why raising the temperature below the optimum speeds an enzyme up.
- Why does the rate level off at high substrate concentration?
- A reaction finishes in 50 s50\,\text{s}50s, so what is the rate in arbitrary units?
- In the pH core practical, what colour change tells you all the starch has been digested?
- Name three variables that must be controlled in that practical.
