Question 4
FLynx are predators. Their main prey is the snowshoe hare.
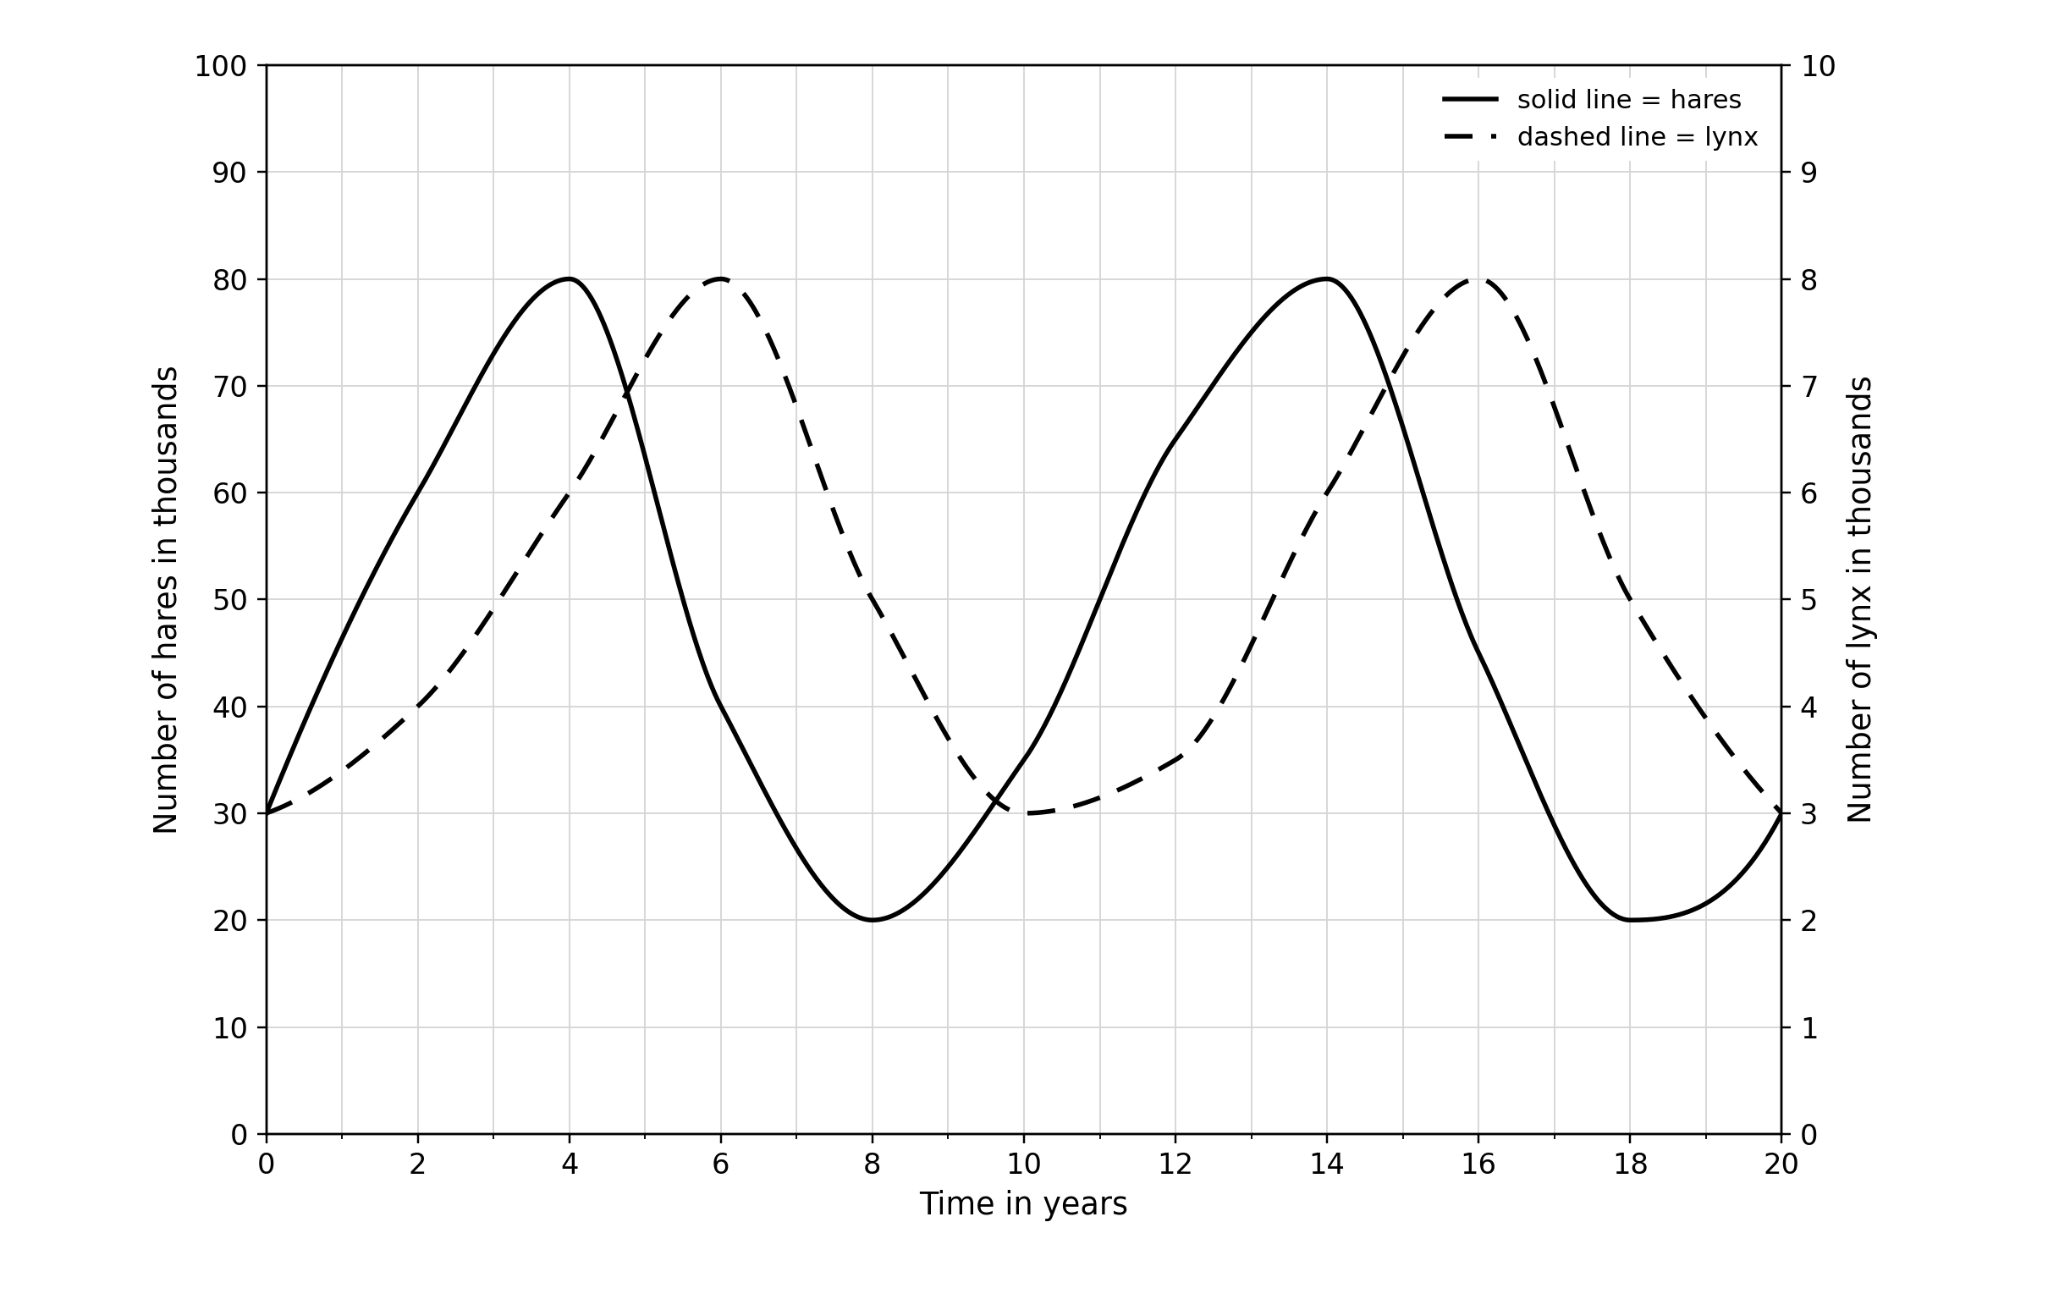
The Figure shows the number of hares and the number of lynx in an area of forest over 20 years.
Figure
a.[1]
Give the year in which the number of hares was highest for the first time.
b.[1]
Calculate the difference between the highest number of lynx and the lowest number of lynx.
c.[2]
Explain why the number of lynx increased between year 2 and year 6.
d.[2]
Explain why the number of hares decreased between year 4 and year 8.
e.[2]
Each peak in the number of lynx comes after a peak in the number of hares.
Explain why.
9.1 Ecosystems and interdependence Questions
39 exam-style questions on Edexcel GCSE Biology 9.1 Ecosystems and interdependence, covering 9.1.1 Levels of organisation in ecosystems, 9.1.2 Abiotic and biotic factors, 9.1.3 Importance of interdependence, 9.1.4 Parasitism and mutualism, and 9.1.5 Determining number of organisms in an area. Each one has a worked solution and a mark scheme showing where the marks go.