Question 17
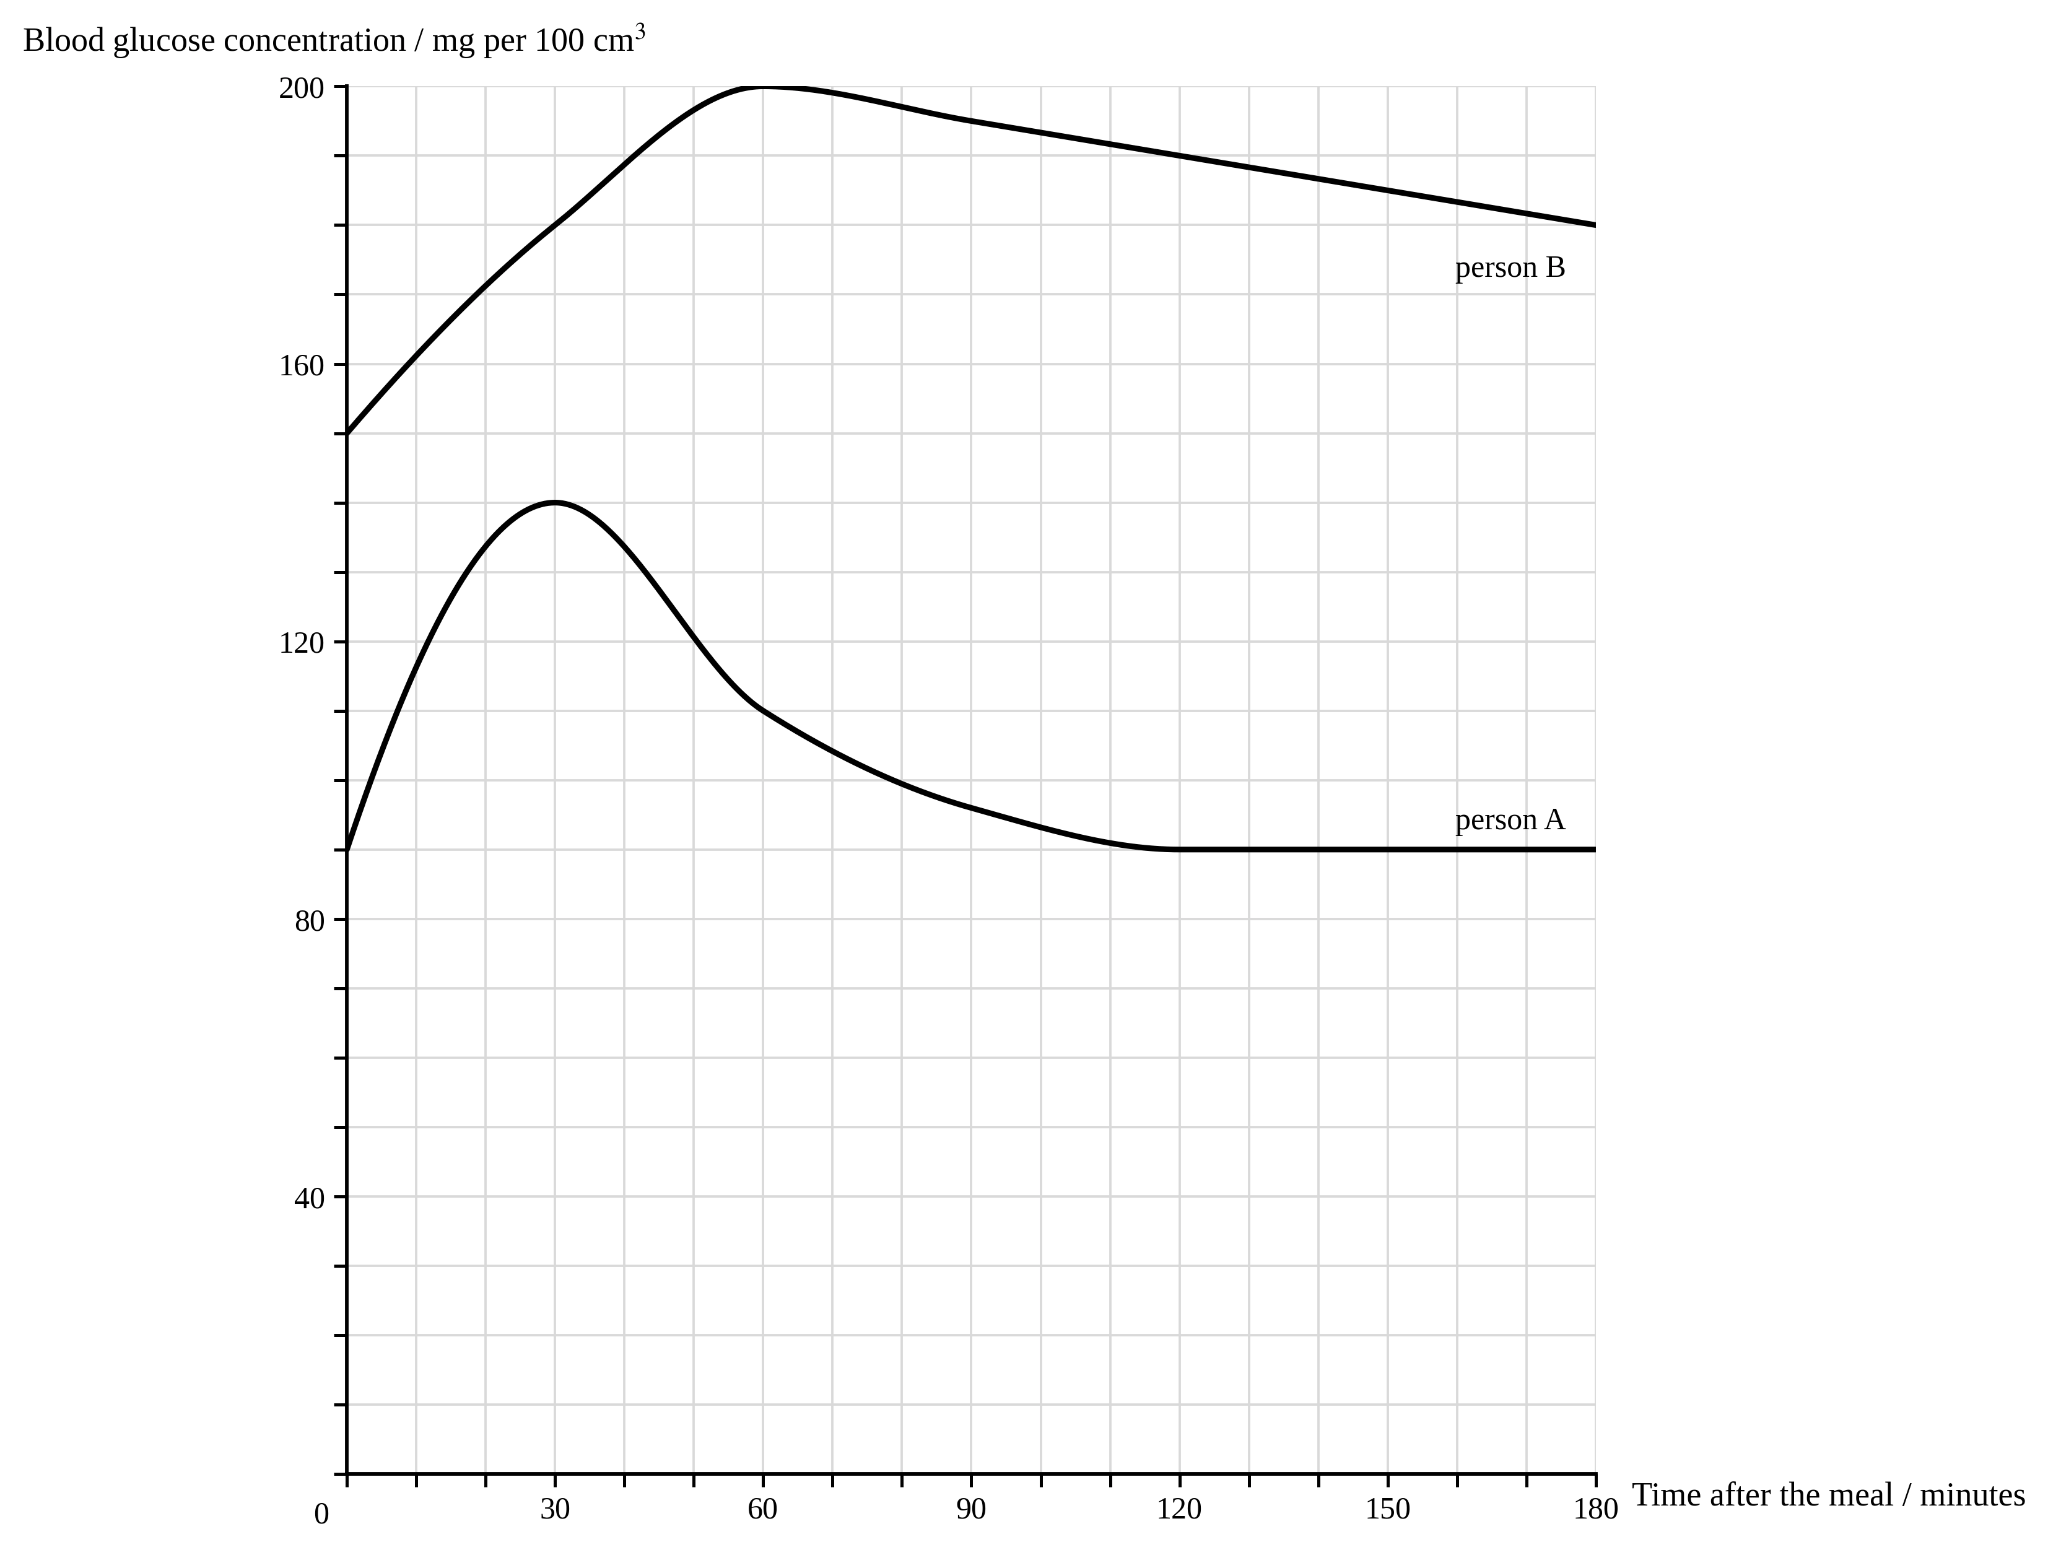
HTwo people, A and B, each ate the same meal. The figure shows the concentration of glucose in their blood for the three hours after the meal.
Figure: Blood glucose concentration of two people for three hours after eating the same meal
a.[2]
Use the figure. Calculate the increase in the blood glucose concentration of person A during the first 30 minutes after the meal. Give the unit.
b.[3]
Compare the control of blood glucose concentration in person A and in person B. Use data from the figure.
c.[2]
Explain what the data suggest about the control system for blood glucose concentration in person B.
5.1 Homeostasis Questions
40 exam-style questions on AQA GCSE Biology 5.1 Homeostasis, covering 5.1 Homeostasis. Each one has a worked solution and a mark scheme showing where the marks go.