

What you'll learn
- How to describe events using probability notation and Venn diagrams.
- How to recognise mutually exclusive and independent events.
- How to use tree diagrams for multi-stage problems.
- How to combine “and” and “or” probabilities accurately.
Probability basics
Probability measures how likely something is to happen. It is always between 0 and 1, where 0 means impossible and 1 means certain.
Event and sample space
- The sample space is the set of all possible outcomes.
- An event is a particular outcome, or group of outcomes, from the sample space.
- The complement of event AAA, written A′A'A′, means “not AAA”.
If all outcomes are equally likely, then:
P(A)=number of favourable outcomestotal number of equally likely outcomesP(A)=\frac{\text{number of favourable outcomes}}{\text{total number of equally likely outcomes}}P(A)=total number of equally likely outcomesnumber of favourable outcomesAlso remember:
0≤P(A)≤10 \le P(A) \le 10≤P(A)≤1and
P(A′)=1−P(A)P(A')=1-P(A)P(A′)=1−P(A)Using a complement
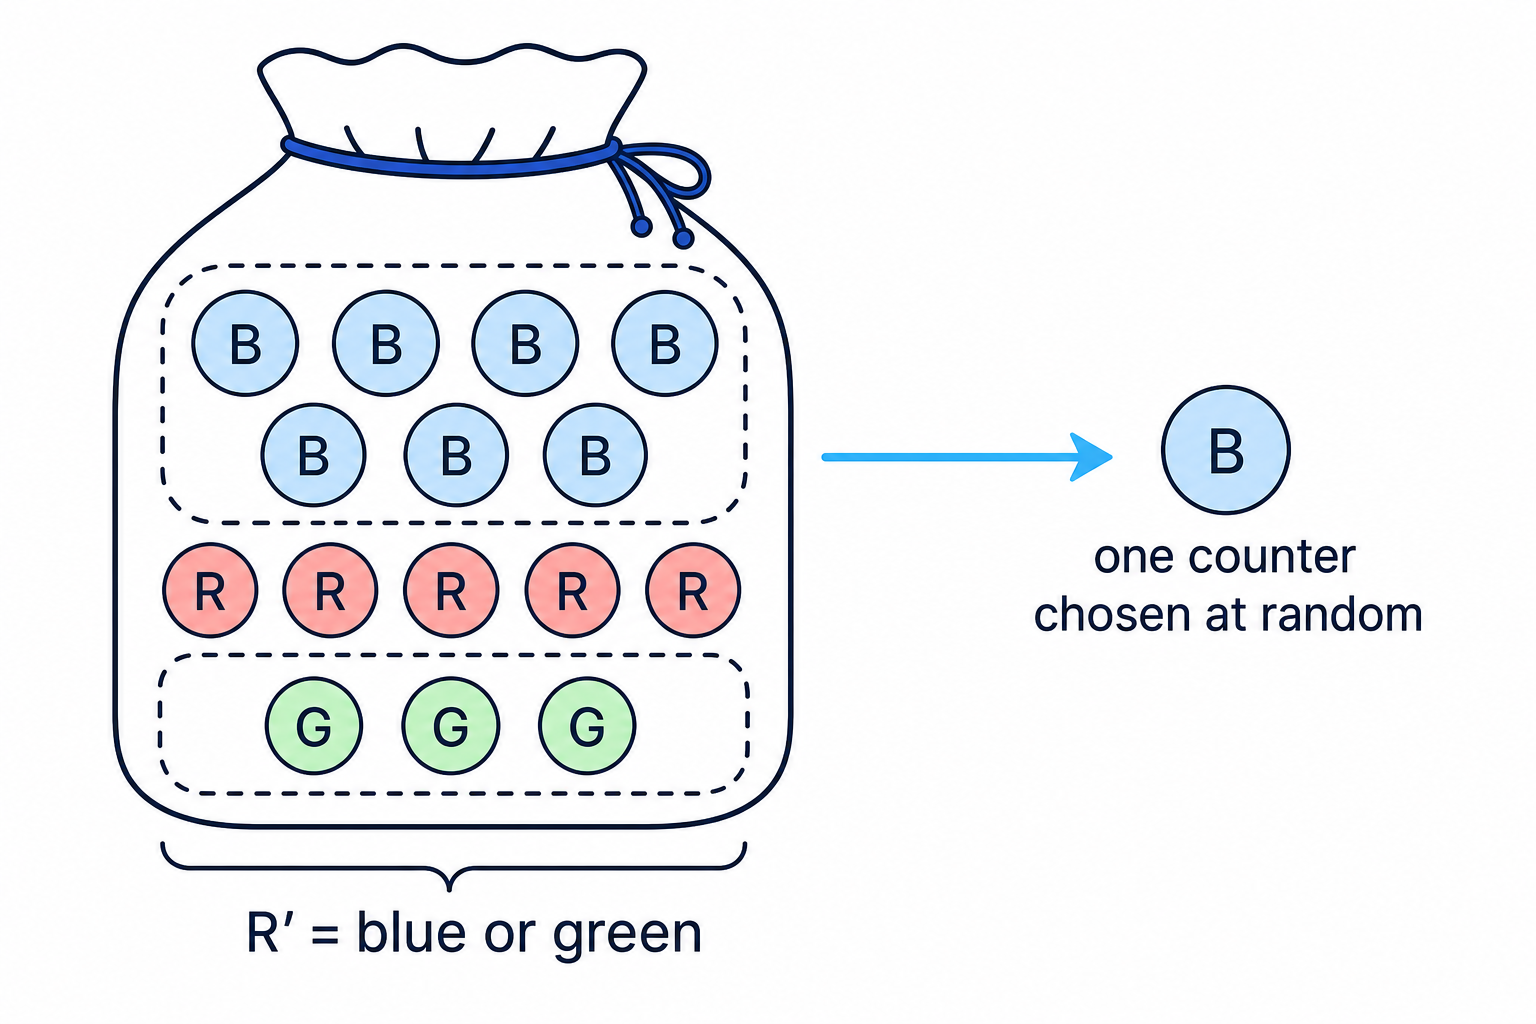
A bag contains 7 blue counters, 5 red counters and 3 green counters. One counter is chosen at random. Find the probability that it is not red.
-
Find the total number of counters:
7+5+3=157+5+3=157+5+3=15 -
Find the probability of choosing a red counter:
P(R)=515=13P(R)=\frac{5}{15}=\frac{1}{3}P(R)=155=31 -
Use the complement rule for “not red”:
P(R′)=1−13=23P(R')=1-\frac{1}{3}=\frac{2}{3}P(R′)=1−31=32
Venn diagrams and set notation
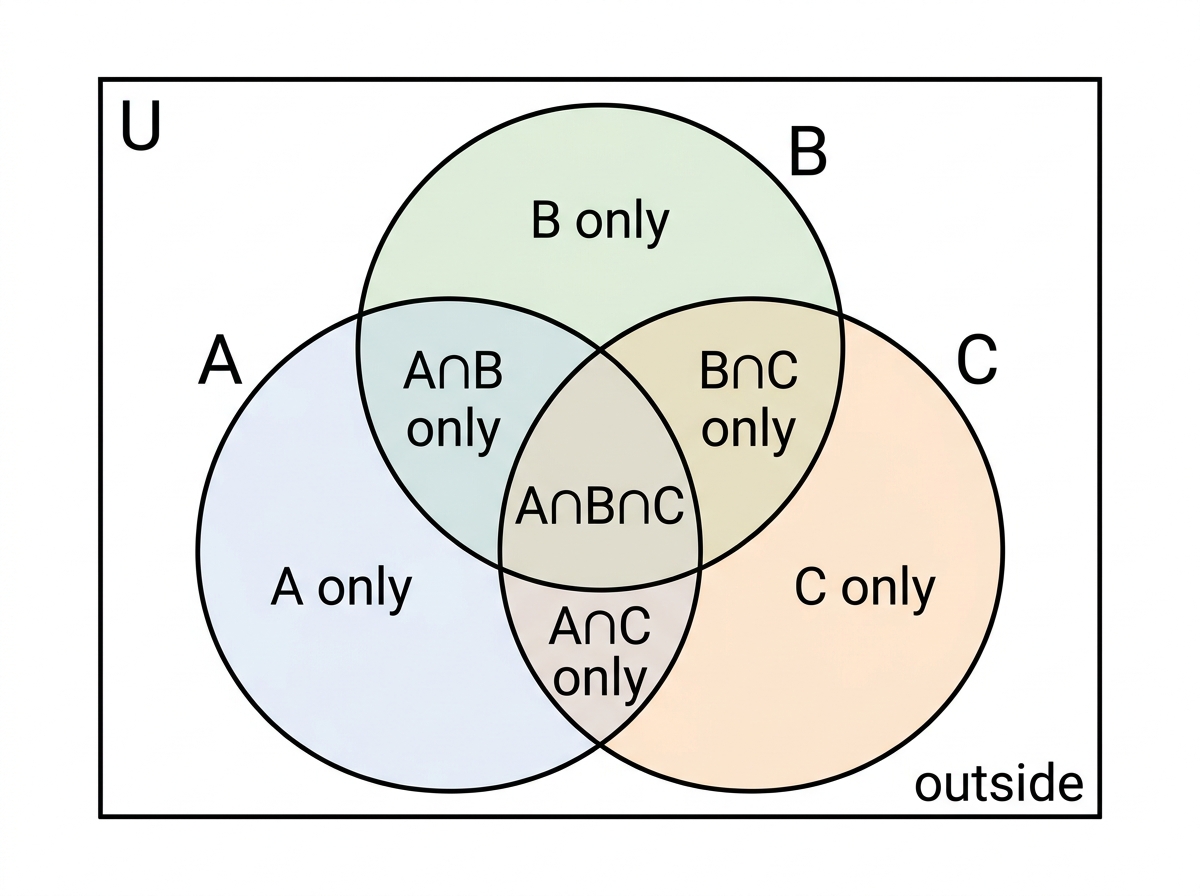
A Venn diagram shows events as circles inside a rectangle. The rectangle represents the universal set: everything being considered.
The overlap between circles represents outcomes that belong to more than one event.
Union and intersection
- A∩BA \cap BA∩B means A and B: the overlap of the two events.
- A∪BA \cup BA∪B means A or B: everything in A, in B, or in both.
- “Or” in probability is inclusive, so it includes the overlap unless told otherwise.
The two-event Venn formula
For any two events:
P(A∪B)=P(A)+P(B)−P(A∩B)P(A \cup B)=P(A)+P(B)-P(A \cap B)P(A∪B)=P(A)+P(B)−P(A∩B)You subtract the overlap because it has been counted twice.
Filling a two-event Venn diagram
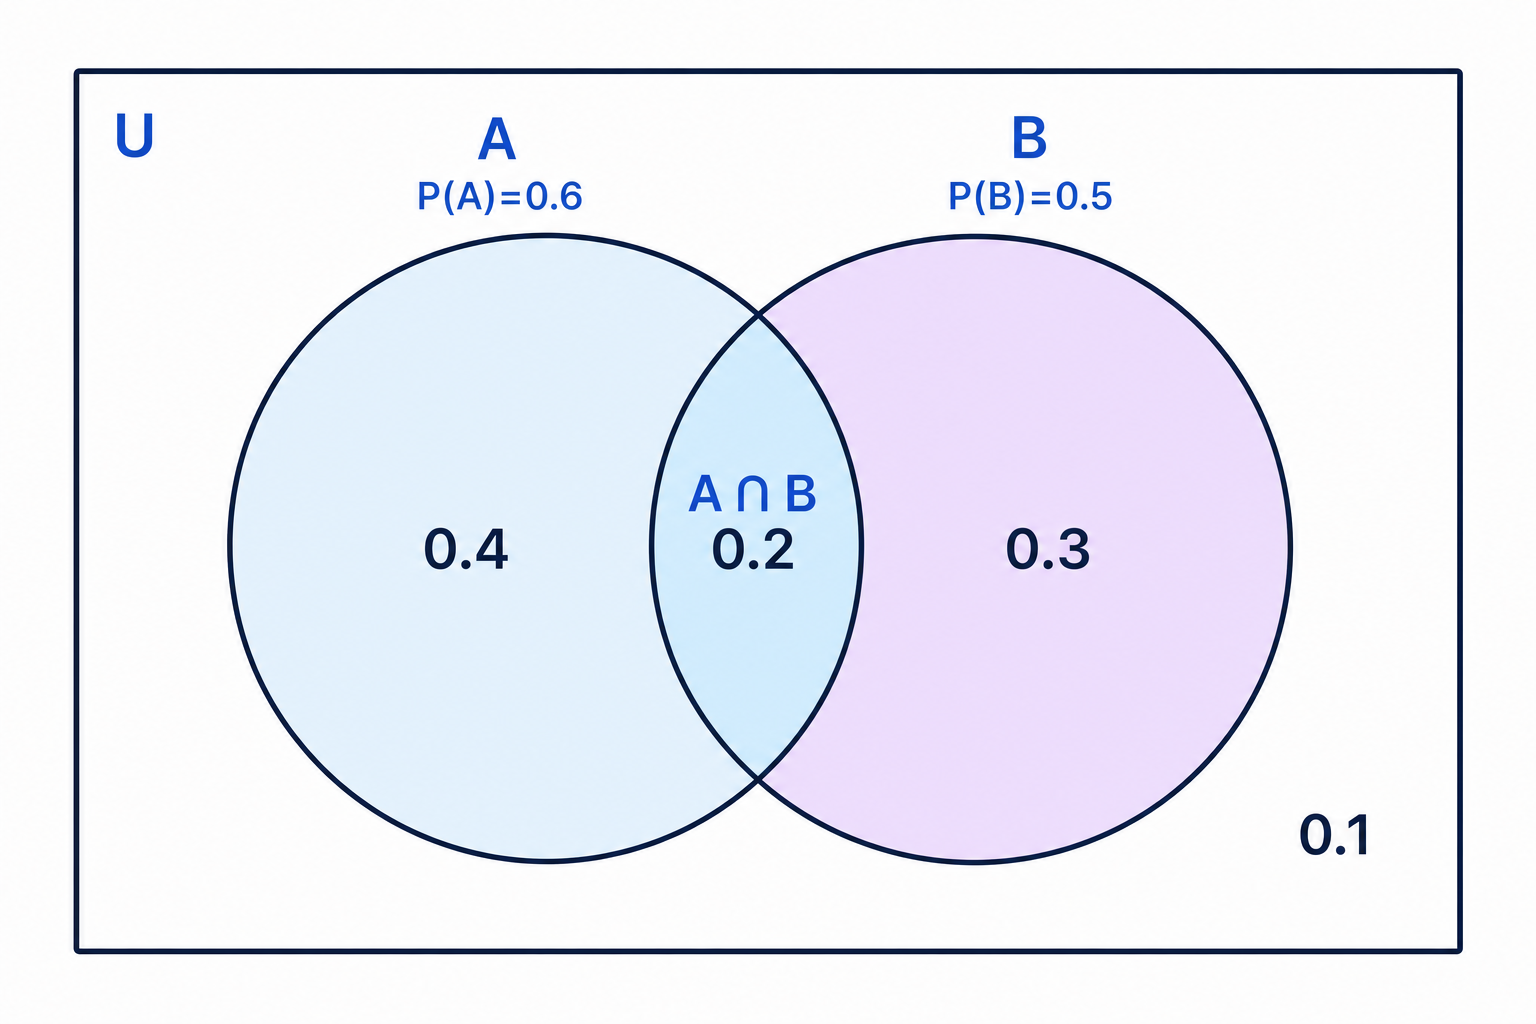
Events AAA and BBB have P(A)=0.6P(A)=0.6P(A)=0.6, P(B)=0.5P(B)=0.5P(B)=0.5, and the probability of neither event is 0.1. Find P(A∩B)P(A \cap B)P(A∩B) and the probability in each region.
-
First find the probability of A∪BA \cup BA∪B, since “neither” is outside both circles:
P(A∪B)=1−0.1=0.9P(A \cup B)=1-0.1=0.9P(A∪B)=1−0.1=0.9 -
Use the Venn formula to find the overlap:
P(A∩B)=0.6+0.5−0.9=0.2P(A \cap B)=0.6+0.5-0.9=0.2P(A∩B)=0.6+0.5−0.9=0.2 -
Find the part in AAA only:
0.6−0.2=0.40.6-0.2=0.40.6−0.2=0.4 -
Find the part in BBB only:
0.5−0.2=0.30.5-0.2=0.30.5−0.2=0.3 -
Check that all regions add to 1:
0.4+0.2+0.3+0.1=10.4+0.2+0.3+0.1=10.4+0.2+0.3+0.1=1
Double-counting the overlap
When finding P(A∪B)P(A \cup B)P(A∪B), do not just add P(A)P(A)P(A) and P(B)P(B)P(B) unless the events have no overlap. If they overlap, the shared region has been counted twice.
Mutually exclusive events
Mutually exclusive events
Two events are mutually exclusive if they cannot happen at the same time.
For mutually exclusive events:
P(A∩B)=0P(A \cap B)=0P(A∩B)=0For example, if one counter is chosen from a bag, the events “it is red” and “it is blue” are mutually exclusive.
Using mutually exclusive events
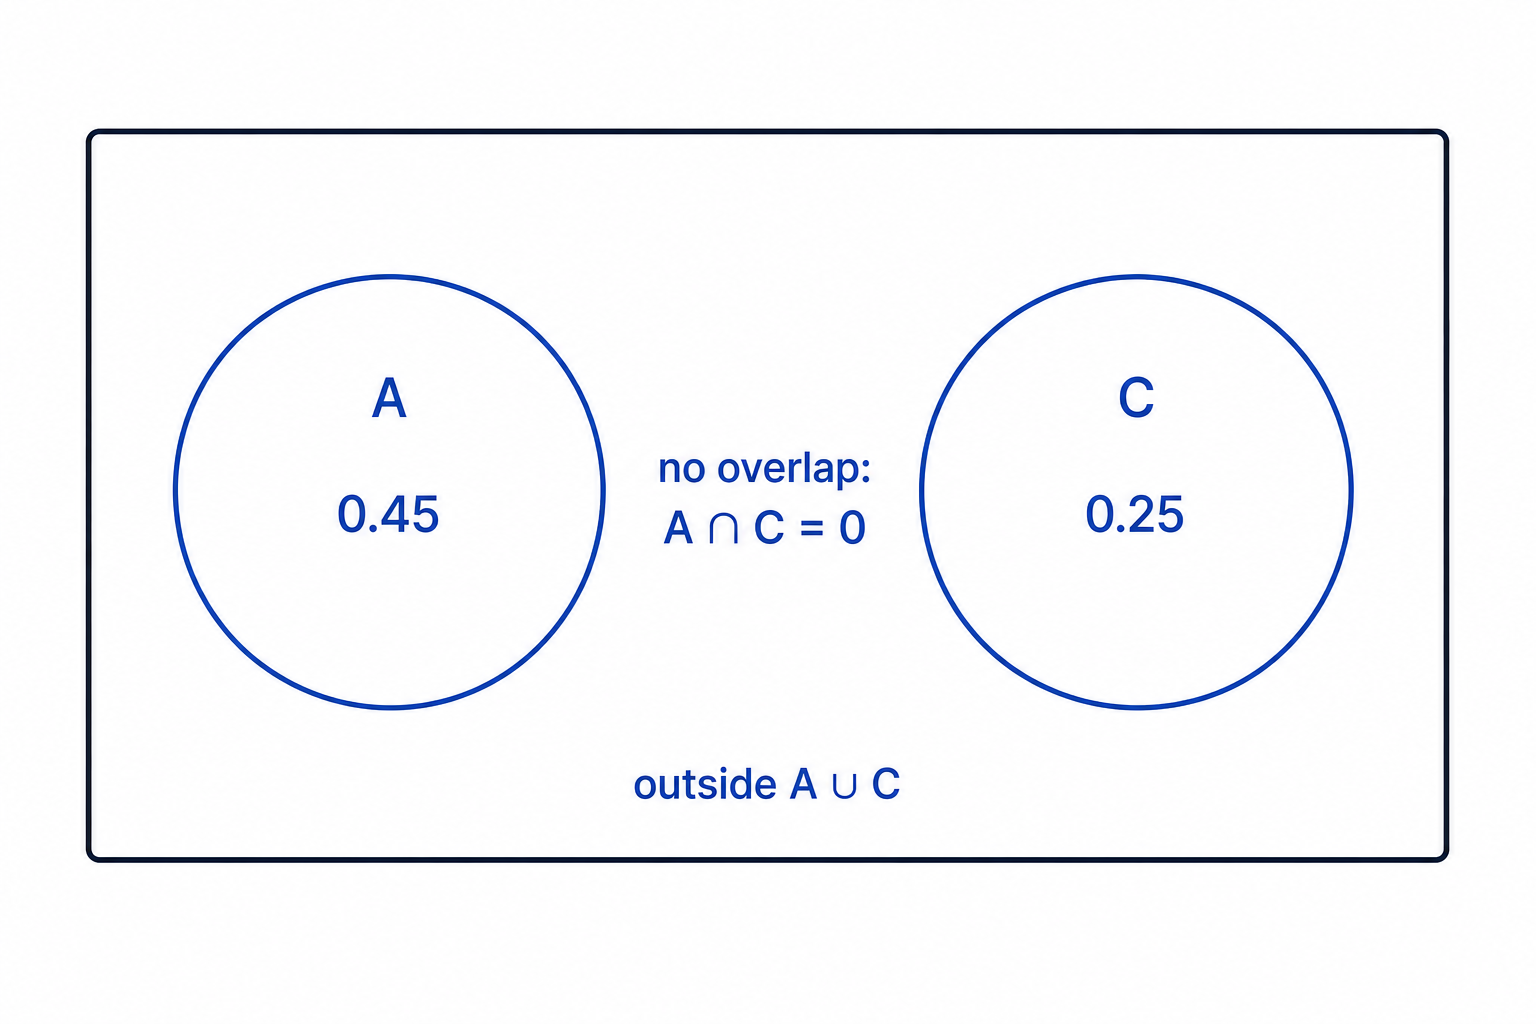
In a Venn diagram, event CCC does not overlap event AAA. Given P(A)=0.45P(A)=0.45P(A)=0.45 and P(C)=0.25P(C)=0.25P(C)=0.25, find P(A∪C)P(A \cup C)P(A∪C).
-
Since AAA and CCC do not overlap, their intersection is zero:
P(A∩C)=0P(A \cap C)=0P(A∩C)=0 -
Use the union formula:
P(A∪C)=P(A)+P(C)−P(A∩C)P(A \cup C)=P(A)+P(C)-P(A \cap C)P(A∪C)=P(A)+P(C)−P(A∩C) -
Substitute the values:
P(A∪C)=0.45+0.25−0=0.70P(A \cup C)=0.45+0.25-0=0.70P(A∪C)=0.45+0.25−0=0.70
Mutually exclusive is not the same as independent
If two events are mutually exclusive and both have positive probability, then knowing one has happened makes the other impossible. That means they are not independent.
Three-set Venn diagrams
For three events, fill the diagram from the middle outwards.
The most important point is that pairwise totals such as “football and golf” usually include people who also chose the third option.
Middle first
In a three-set Venn diagram, put the “all three” value in the centre first. Then subtract it from each two-way overlap before finding the “only” regions.
Completing a three-set Venn diagram
A group of 50 people are asked which sports they watch: football, golf and hockey.
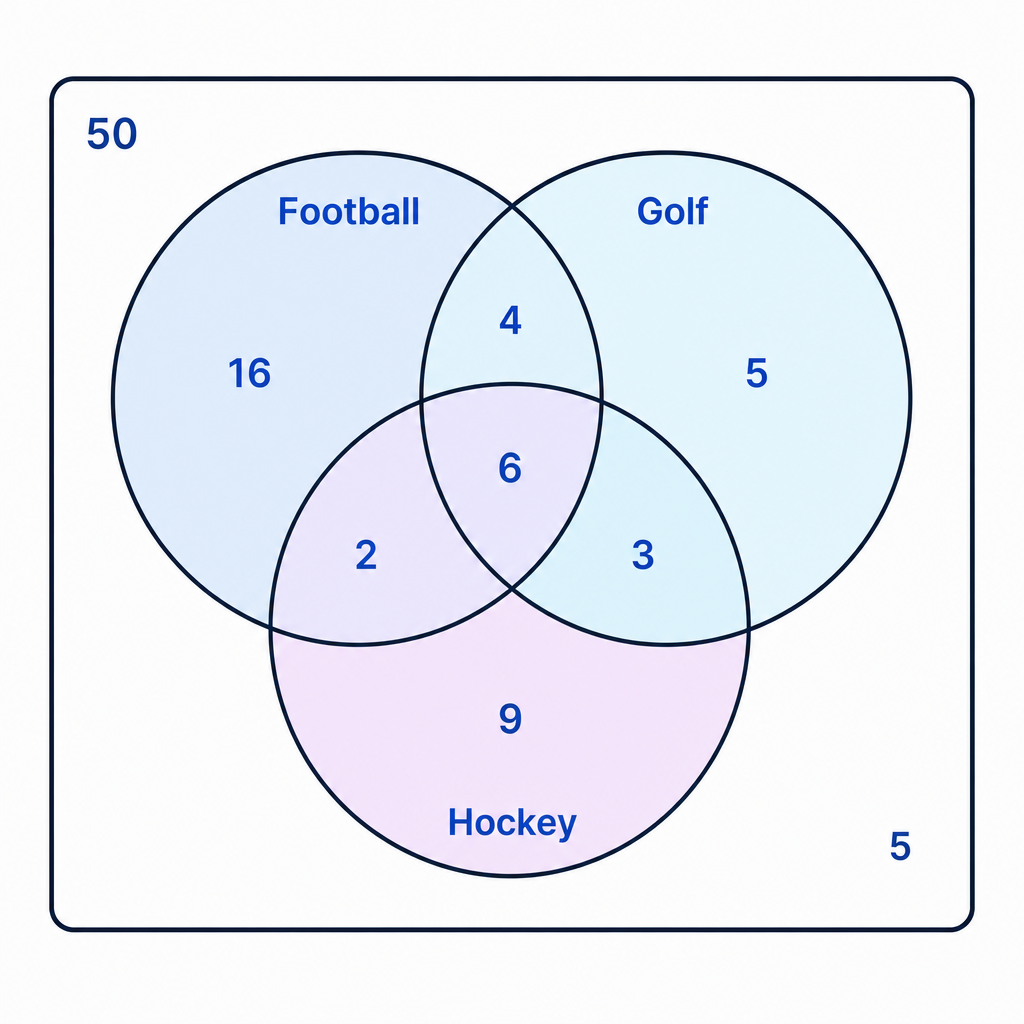
6 watch all three sports.
10 watch football and golf.
9 watch golf and hockey.
8 watch football and hockey.
28 watch football, 18 watch golf and 20 watch hockey.
Complete the Venn diagram and find the probability that two people chosen at random both watch football.
-
Put the “all three” value in the centre:
666 -
Subtract the centre from each pairwise total:
football and golf only=10−6=4golf and hockey only=9−6=3football and hockey only=8−6=2\begin{aligned} \text{football and golf only} &= 10-6=4\\ \text{golf and hockey only} &= 9-6=3\\ \text{football and hockey only} &= 8-6=2 \end{aligned}football and golf onlygolf and hockey onlyfootball and hockey only=10−6=4=9−6=3=8−6=2 -
Find each “only” region:
football only=28−4−2−6=16golf only=18−4−3−6=5hockey only=20−2−3−6=9\begin{aligned} \text{football only} &= 28-4-2-6=16\\ \text{golf only} &= 18-4-3-6=5\\ \text{hockey only} &= 20-2-3-6=9 \end{aligned}football onlygolf onlyhockey only=28−4−2−6=16=18−4−3−6=5=20−2−3−6=9 -
Find how many people watch none of the three sports:
50−(16+5+9+4+3+2+6)=550-(16+5+9+4+3+2+6)=550−(16+5+9+4+3+2+6)=5 -
For two people both watching football, sample without replacement:
2850×2749=3781225≈0.309\frac{28}{50}\times\frac{27}{49}=\frac{378}{1225}\approx 0.3095028×4927=1225378≈0.309
Independent events
Independent events
Two events are independent if the outcome of one event does not affect the probability of the other.
For independent events:
P(A∩B)=P(A)P(B)P(A \cap B)=P(A)P(B)P(A∩B)=P(A)P(B)This formula is the test you should use when asked whether two events are statistically independent.
Testing for independence
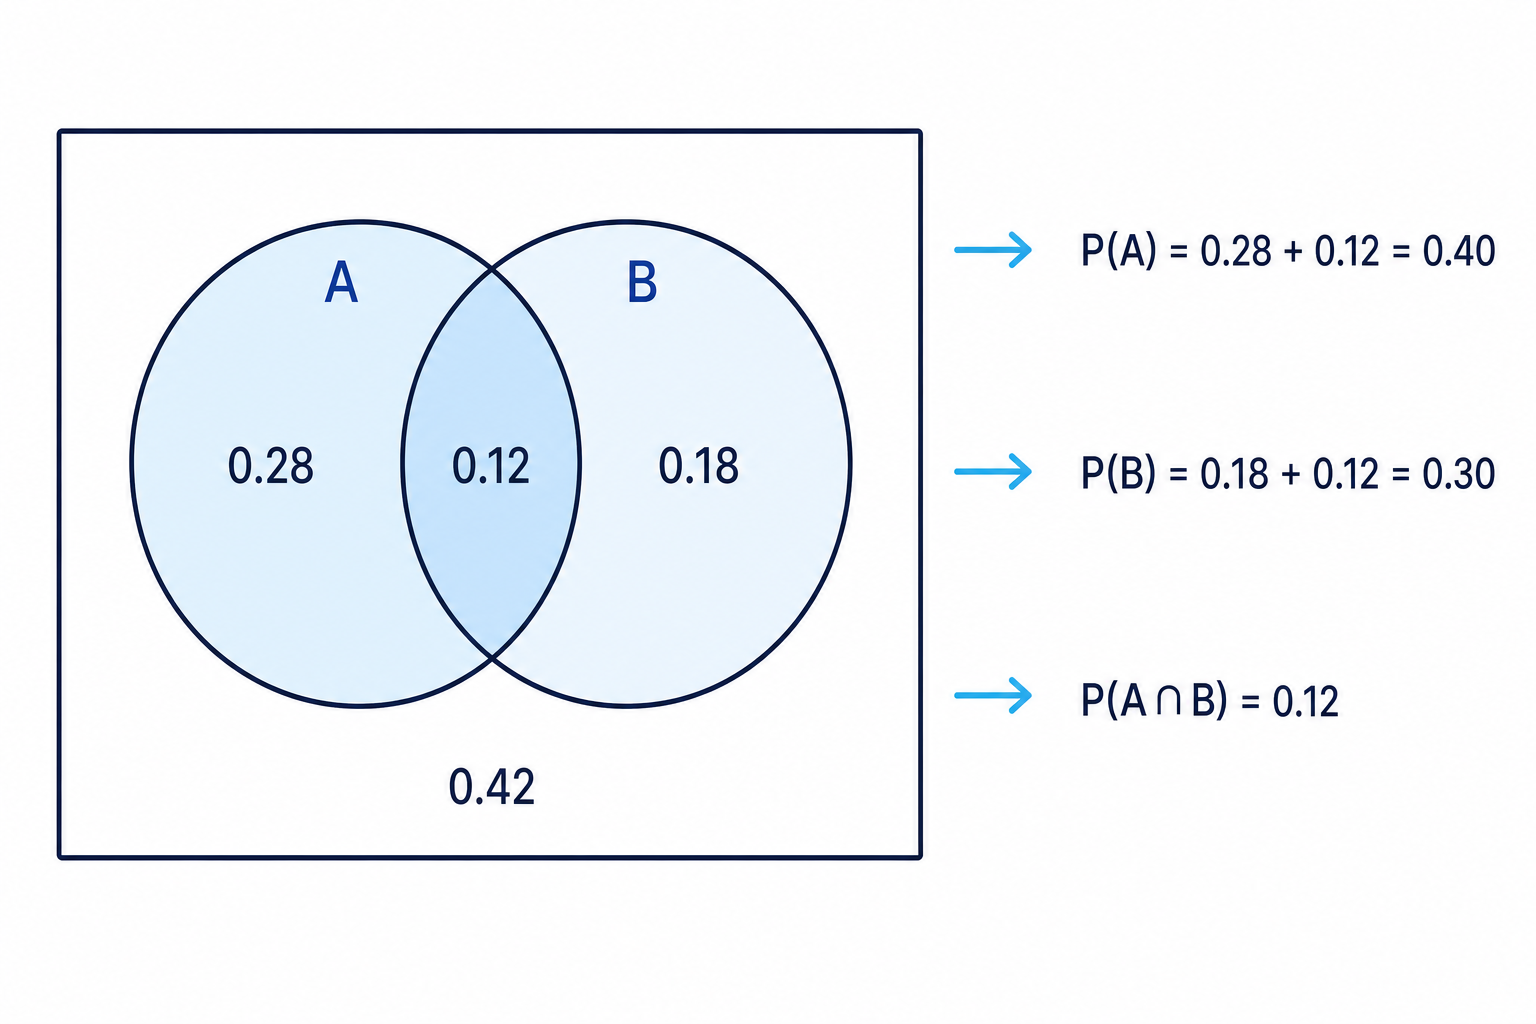
A completed Venn diagram has these regions: AAA only is 0.28, BBB only is 0.18, the overlap is 0.12, and outside both is 0.42. Decide whether AAA and BBB are independent.
-
Find P(A)P(A)P(A) by adding the regions inside circle AAA:
P(A)=0.28+0.12=0.40P(A)=0.28+0.12=0.40P(A)=0.28+0.12=0.40 -
Find P(B)P(B)P(B) by adding the regions inside circle BBB:
P(B)=0.18+0.12=0.30P(B)=0.18+0.12=0.30P(B)=0.18+0.12=0.30 -
Compare the actual overlap with the product:
P(A)P(B)=0.40×0.30=0.12P(A)P(B)=0.40\times 0.30=0.12P(A)P(B)=0.40×0.30=0.12 -
Since this equals the overlap, the events are independent:
P(A∩B)=P(A)P(B)P(A \cap B)=P(A)P(B)P(A∩B)=P(A)P(B)
How to write the reason
For independence questions, write a full reason such as: “Yes, because P(A∩B)=P(A)P(B)P(A \cap B)=P(A)P(B)P(A∩B)=P(A)P(B).” A bare “yes” is not enough.
Tree diagrams
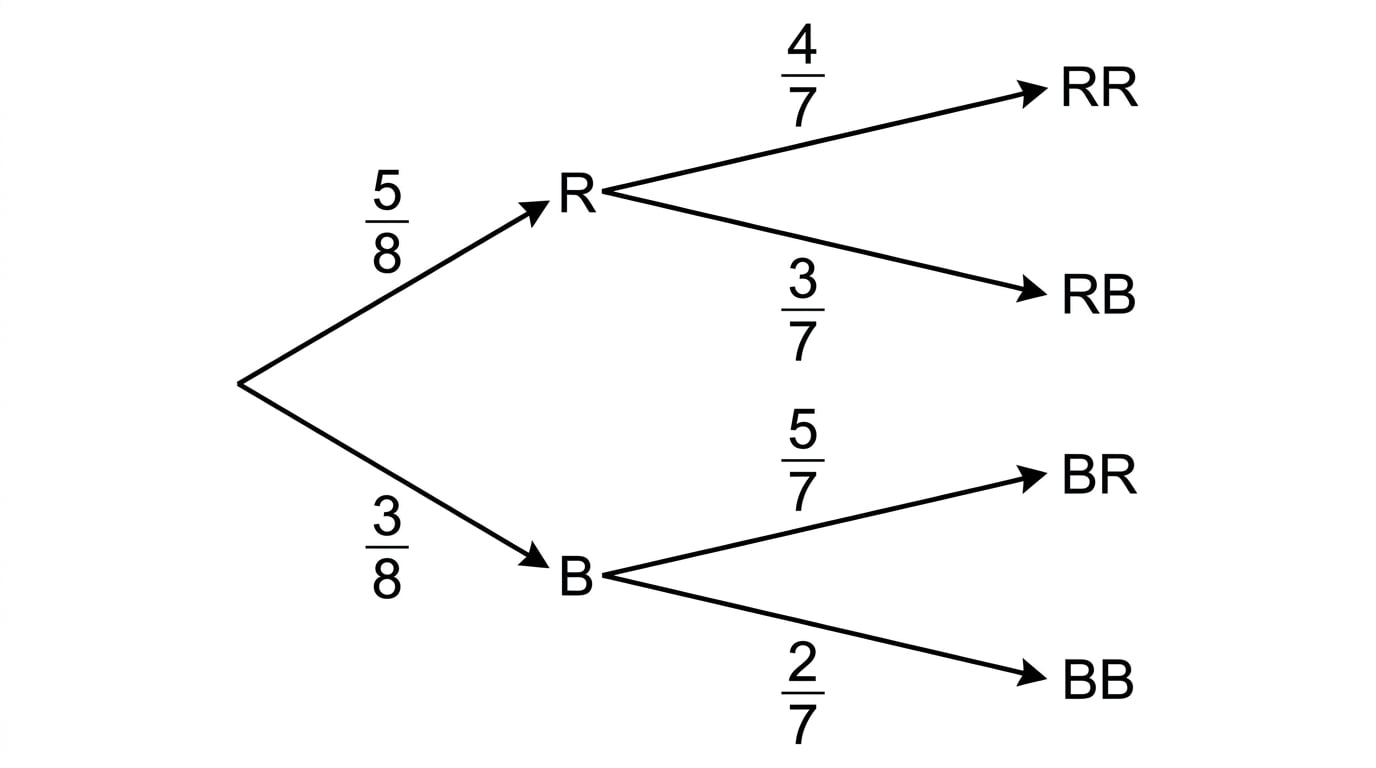
A tree diagram shows a probability experiment in stages. Each branch has a probability.
For staged events:
- Multiply along branches for “and”.
- Add separate routes for “or”.
- If there is no replacement, update the numbers after the first choice.
Conditional probability
A conditional probability is the probability of an event given that something else has already happened.
It is written as P(B∣A)P(B\mid A)P(B∣A), meaning “the probability of BBB given AAA”.
Two items without replacement
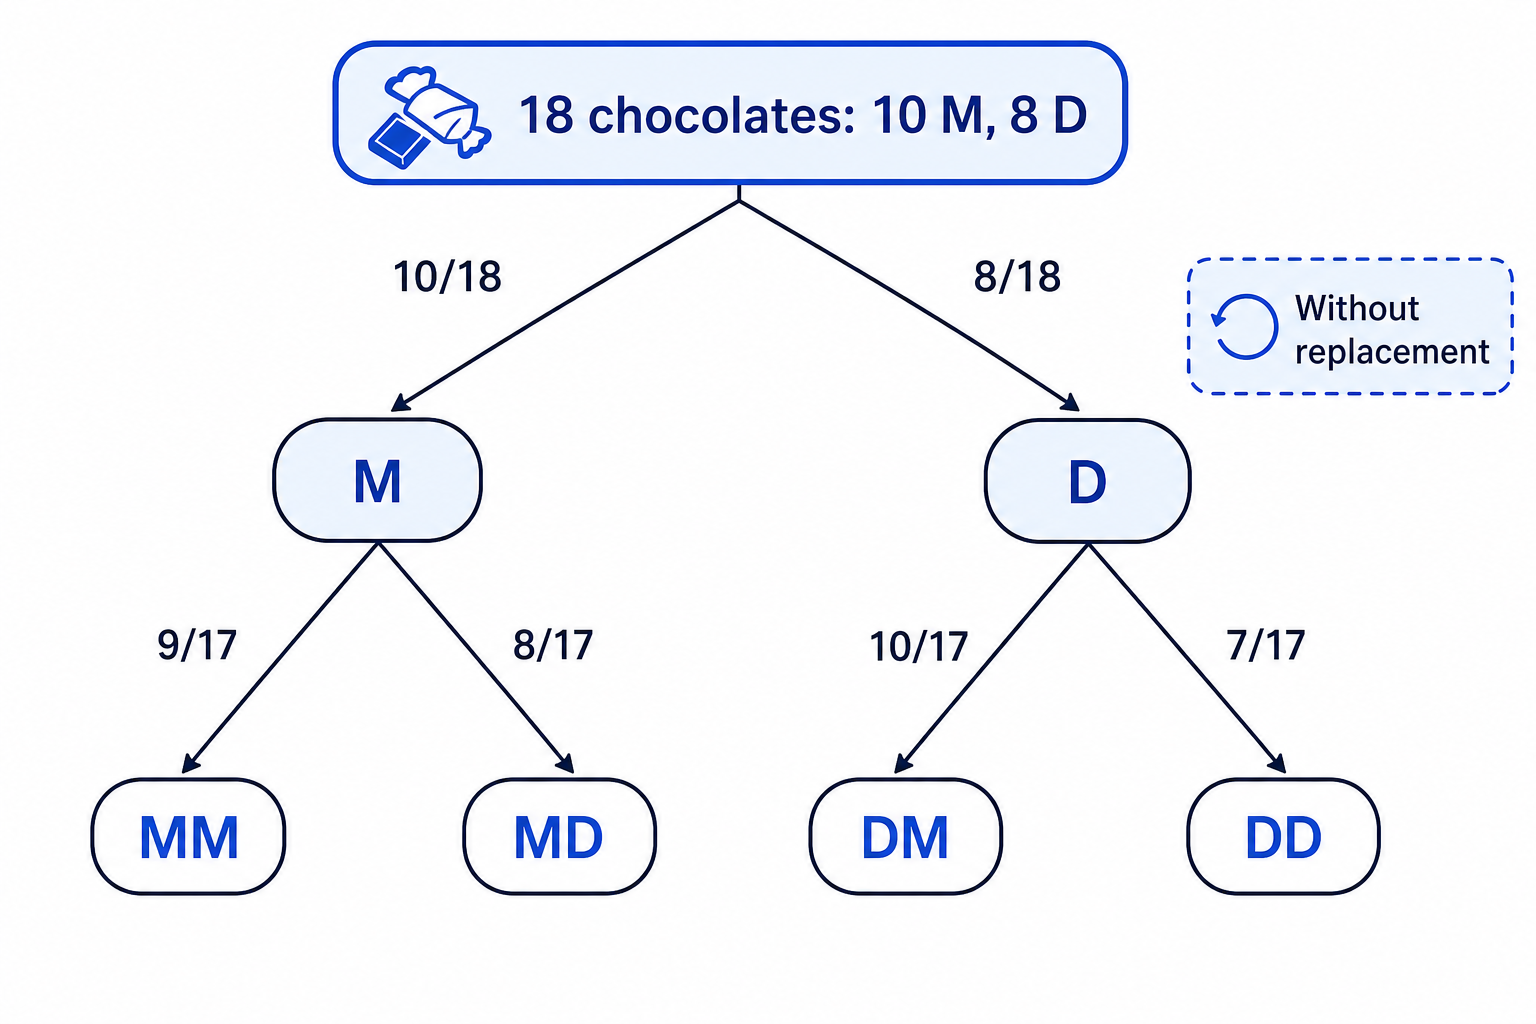
A box contains 10 milk chocolates and 8 dark chocolates. Connor takes two chocolates at random without replacement. Find the probability that he takes two dark chocolates, and the probability that he takes one of each type.
-
For two dark chocolates, multiply down the dark-then-dark route:
P(DD)=818×717=28153P(DD)=\frac{8}{18}\times\frac{7}{17}=\frac{28}{153}P(DD)=188×177=15328 -
For one of each type, there are two possible orders: milk then dark, or dark then milk.
P(MD)=1018×817=40153P(DM)=818×1017=40153\begin{aligned} P(MD)&=\frac{10}{18}\times\frac{8}{17}=\frac{40}{153}\\ P(DM)&=\frac{8}{18}\times\frac{10}{17}=\frac{40}{153} \end{aligned}P(MD)P(DM)=1810×178=15340=188×1710=15340 -
Add the two routes:
P(one of each)=40153+40153=80153P(\text{one of each})=\frac{40}{153}+\frac{40}{153}=\frac{80}{153}P(one of each)=15340+15340=15380
Forgetting the second order
“One of each” usually has two routes: first type A then type B, or first type B then type A. Work out both unless the question fixes the order.
Total probability
Sometimes an outcome can happen through several different routes. Find each route probability, then add them.
Faulty components from different machines
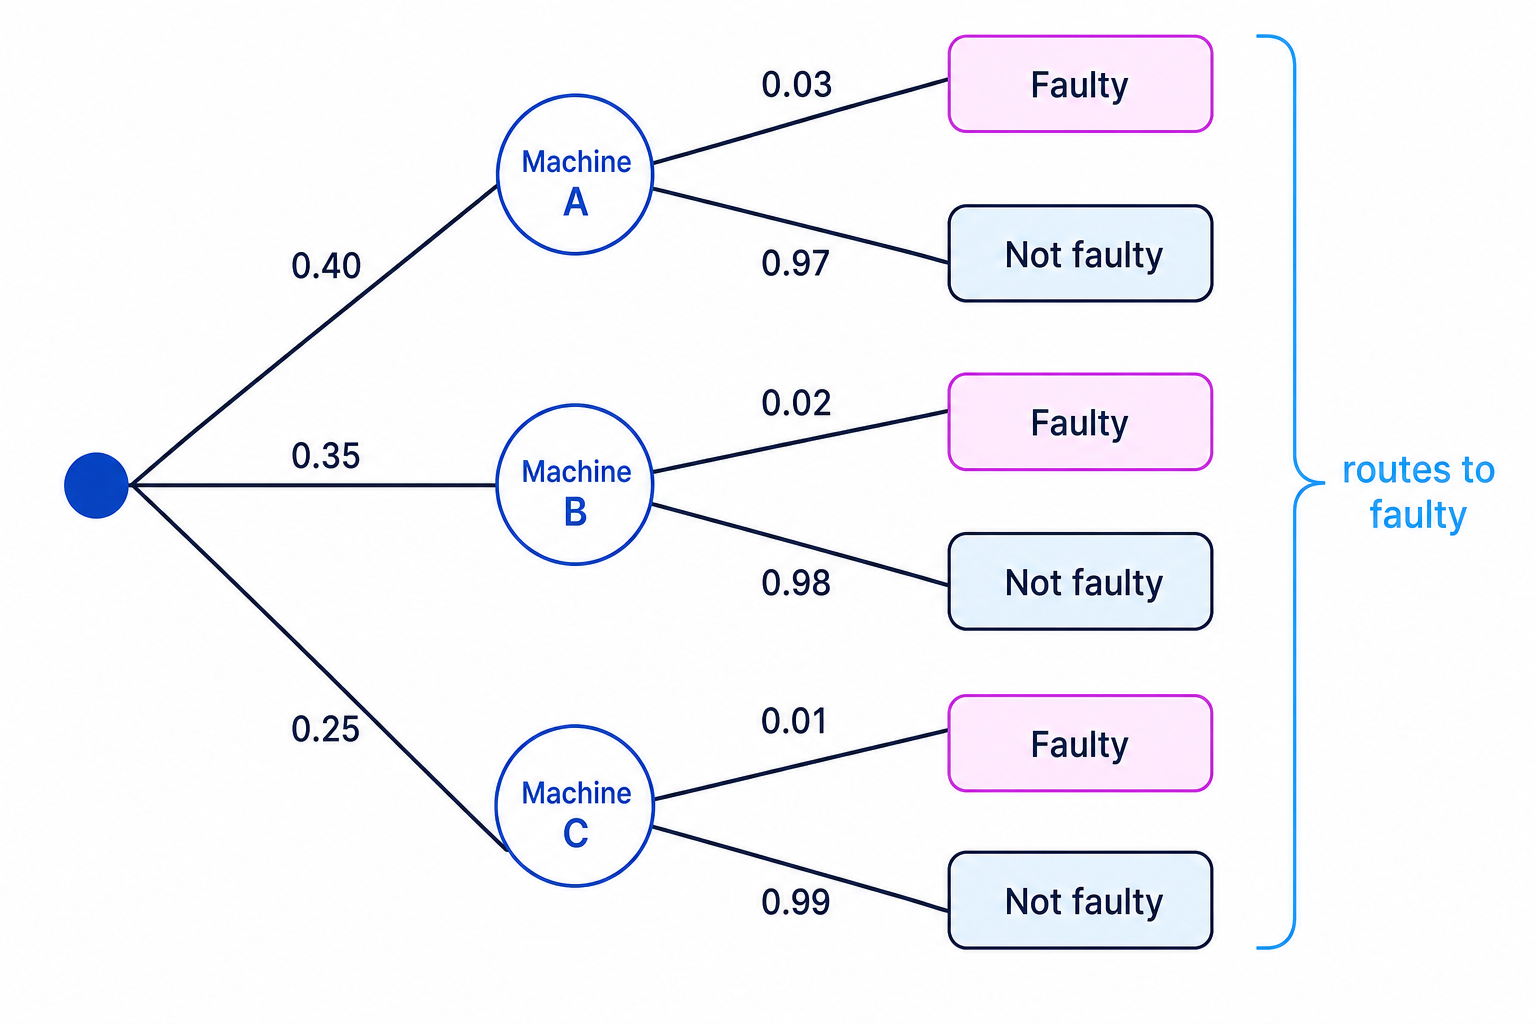
A factory uses three machines. Machine A makes 40% of the components, machine B makes 35%, and machine C makes 25%. The faulty rates are 3% for A, 2% for B and 1% for C. Find the probability that a randomly selected component is from A and faulty, then find the probability that it is faulty.
-
Convert the percentages to decimals before multiplying.
-
For “from A and faulty”, multiply along that route:
P(A and faulty)=0.40×0.03=0.012P(\text{A and faulty})=0.40\times 0.03=0.012P(A and faulty)=0.40×0.03=0.012 -
A faulty component can come from A, B or C, so add the three routes:
P(faulty)=(0.40×0.03)+(0.35×0.02)+(0.25×0.01)P(\text{faulty})=(0.40\times 0.03)+(0.35\times 0.02)+(0.25\times 0.01)P(faulty)=(0.40×0.03)+(0.35×0.02)+(0.25×0.01) -
Calculate the final probability:
P(faulty)=0.012+0.007+0.0025=0.0215P(\text{faulty})=0.012+0.007+0.0025=0.0215P(faulty)=0.012+0.007+0.0025=0.0215
In the exam
-
Label every region or branch clearly before doing calculations.
-
For Venn diagrams, remember: all regions must add to 1 for probabilities, or to the total number of people/items for frequencies.
-
For tree diagrams, multiply along a route and add different routes; check whether the experiment is with or without replacement.
Check yourself
-
Can you explain the difference between mutually exclusive and independent events?
-
In a three-set Venn diagram, why do you fill the centre first?
-
When a question asks for “one of each”, have you considered both possible orders?
