Revision notes for Edexcel AS Level Maths Measures of Location and Spread. Open each subtopic for explanations, worked examples, and summaries of Measures of Central Tendency, Other Measures of Location, Measures of Spread, Variance and Standard Deviation, and Coding. Written against the Edexcel AS Level Maths (8MA0) specification, so the content matches what's examinable rather than general Maths background.
Measures of Location and Spread
What you'll learn
- How to describe the “centre” of a data set using the mean, median and quartiles.
- How to describe how spread out data are using range, interquartile range and standard deviation.
- How to estimate averages and standard deviation from grouped data.
- How coding affects the median, mean and standard deviation.
1. What are measures of location and spread?
In statistics, a long list of data is often hard to interpret directly. We use summary measures to describe the data quickly.
Definition
Measures of location and spread
-
A measure of location tells you where the data are centred. Common examples are the mean, median and quartiles.
-
A measure of spread tells you how varied the data are. Common examples are the range, interquartile range and standard deviation.
Key Idea
The big picture
A good statistical summary usually needs both a measure of location and a measure of spread: one tells you the typical value, the other tells you how consistent the data are.
2. Mean, median and quartiles for raw data
The mean is the arithmetic average. For data values called xxx, the mean is written as xˉ\bar{x}xˉ.
xˉ=∑xn\bar{x}=\frac{\sum x}{n}xˉ=n∑xHere, nnn is the number of data values, and ∑x\sum x∑x means “add all the data values”.
The median is the middle value when the data are in order.
The quartiles split ordered data into quarters:
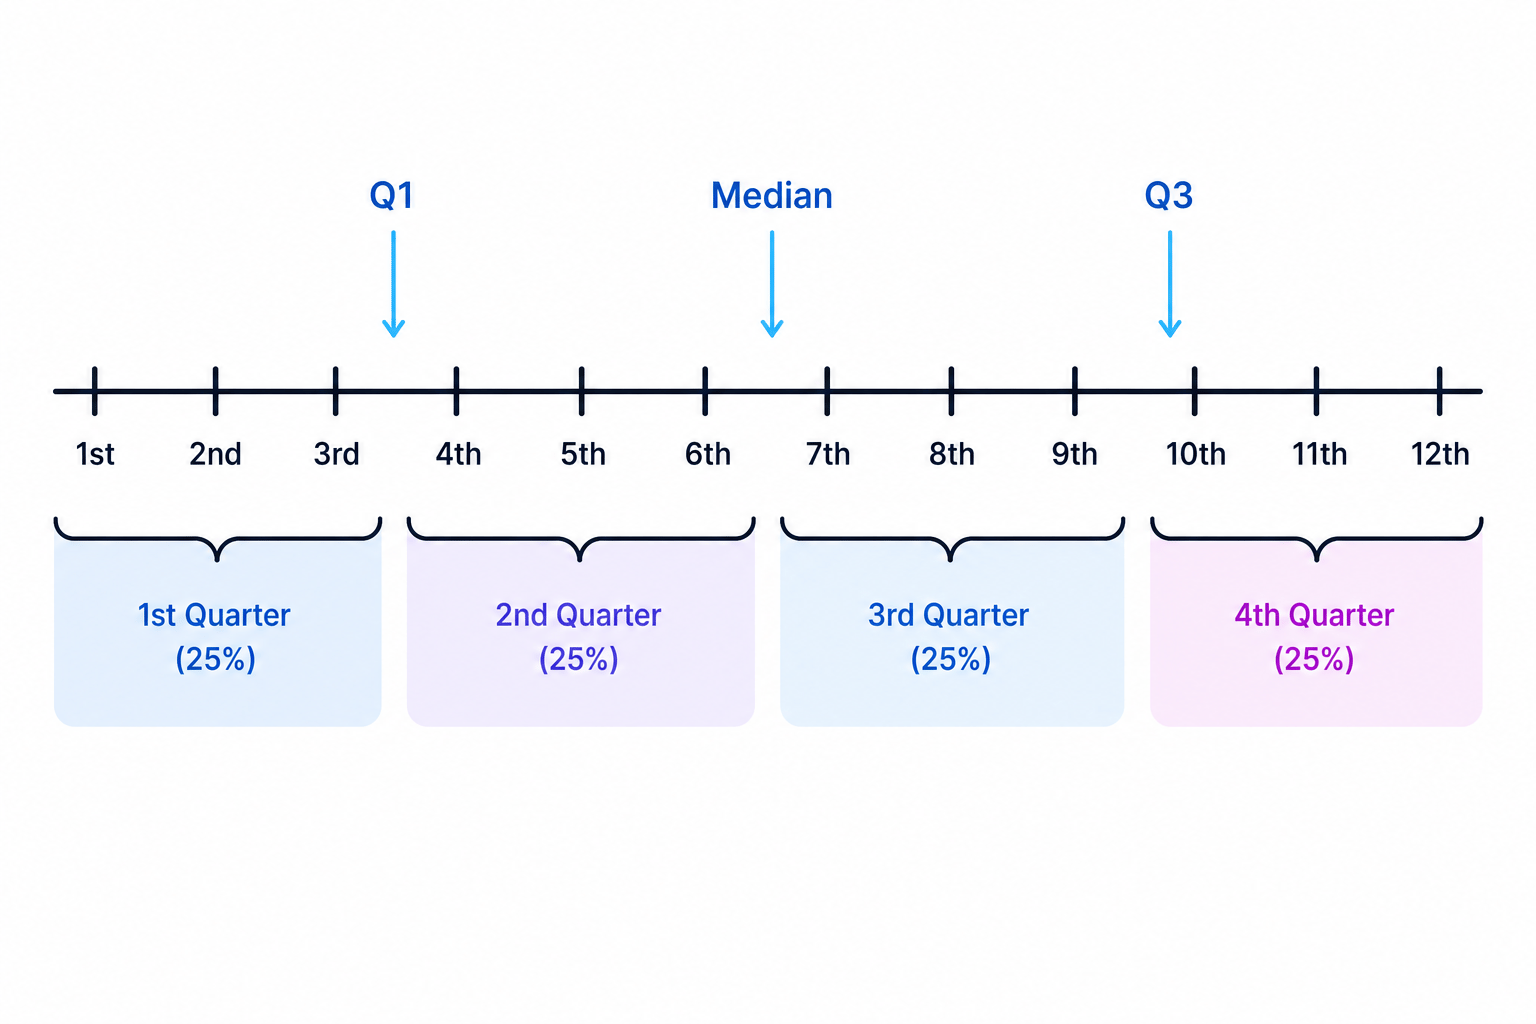
- The lower quartile, usually written Q1Q_1Q1, is around one quarter of the way through the data.
- The upper quartile, usually written Q3Q_3Q3, is around three quarters of the way through the data.
- The interquartile range is Q3−Q1Q_3-Q_1Q3−Q1.
Example
Finding the mean, median and quartiles from raw times
Twelve runners record these 400 m times, in seconds:
46.3, 45.0, 45.8, 47.1, 45.6, 46.0, 45.4, 46.8, 45.9, 45.5, 46.2, 45.7
-
Add the times and divide by 12 to find the mean.
xˉ=551.312=45.941…\bar{x}=\frac{551.3}{12}=45.941\ldotsxˉ=12551.3=45.941… -
Round sensibly, so the mean time is about 45.9 s.
-
Put the data in ascending order.
45.0, 45.4, 45.5, 45.6, 45.7, 45.8, 45.9, 46.0, 46.2, 46.3, 46.8, 47.145.0,\ 45.4,\ 45.5,\ 45.6,\ 45.7,\ 45.8,\ 45.9,\ 46.0,\ 46.2,\ 46.3,\ 46.8,\ 47.145.0, 45.4, 45.5, 45.6, 45.7, 45.8, 45.9, 46.0, 46.2, 46.3, 46.8, 47.1 -
Since there are 12 values, the median is halfway between the 6th and 7th values.
median=45.8+45.92=45.85\text{median}=\frac{45.8+45.9}{2}=45.85median=245.8+45.9=45.85 -
The lower half is the first 6 values, so Q1Q_1Q1 is halfway between the 3rd and 4th values.
Q1=45.5+45.62=45.55Q_1=\frac{45.5+45.6}{2}=45.55Q1=245.5+45.6=45.55 -
The upper half is the last 6 values, so Q3Q_3Q3 is halfway between the 9th and 10th values.
Q3=46.2+46.32=46.25Q_3=\frac{46.2+46.3}{2}=46.25Q3=246.2+46.3=46.25
Common Mistake
Forgetting to order the data
You must order the data before finding the median or quartiles. The middle value in the original list is usually meaningless.
3. Standard deviation
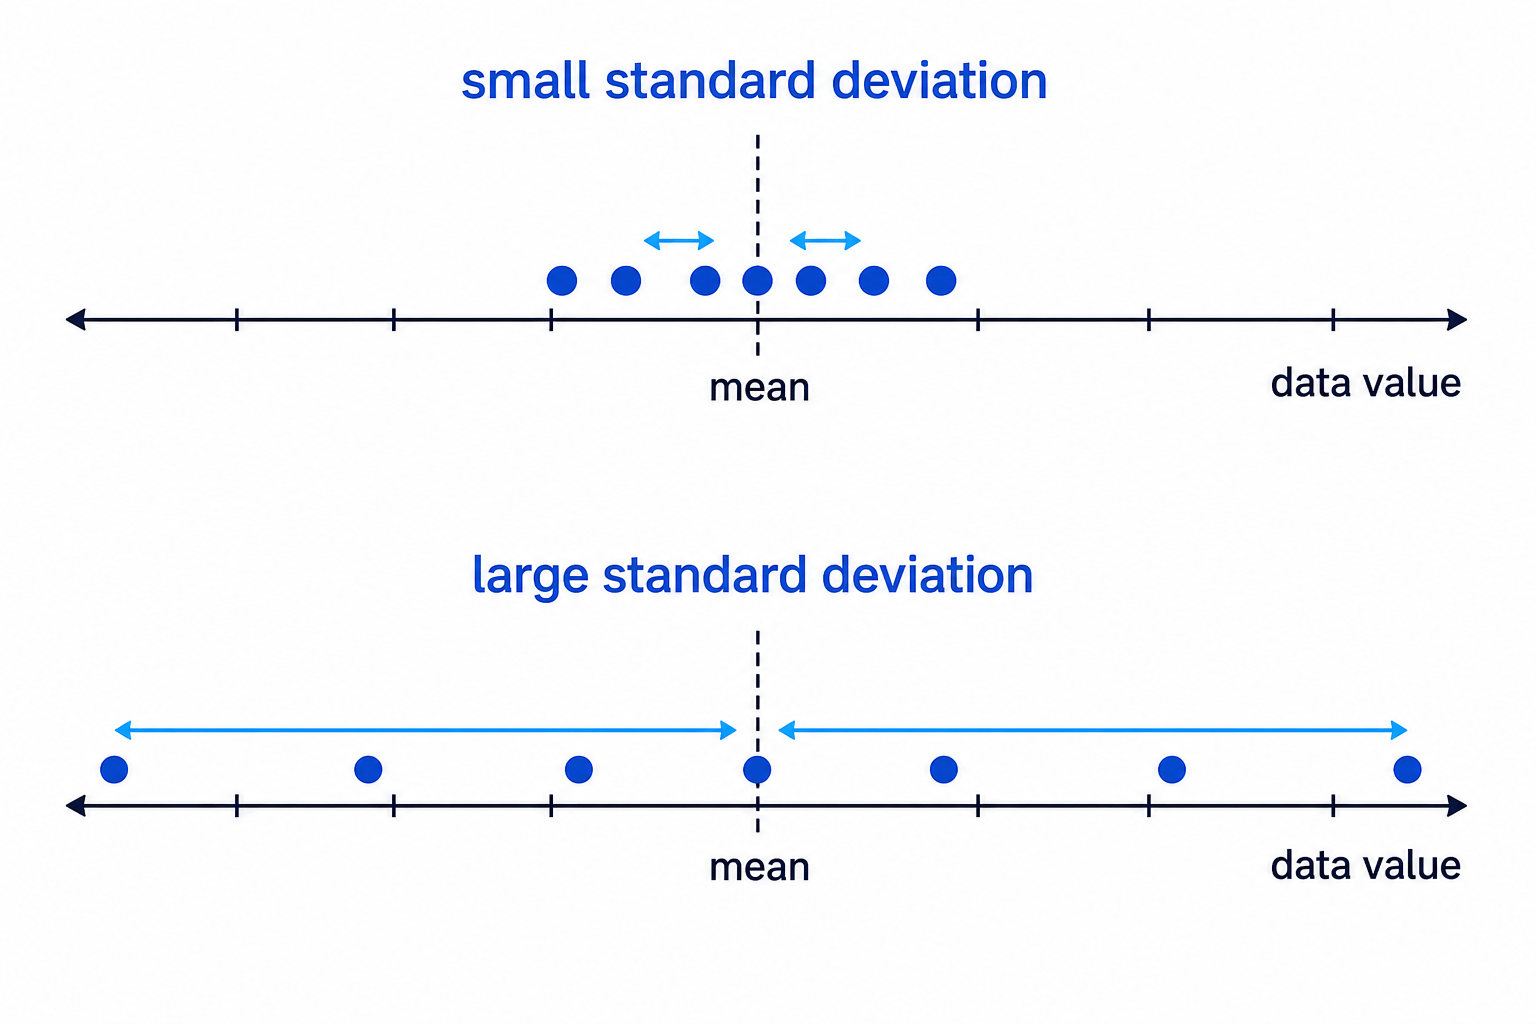
The standard deviation measures how far the data values typically are from the mean. A small standard deviation means the values are tightly clustered; a large standard deviation means they are more spread out.
Definition
Standard deviation formula
For AS-Level statistics questions using a whole data set or summary statistics, use
standard deviation=∑x2n−xˉ2\text{standard deviation}=\sqrt{\frac{\sum x^2}{n}-\bar{x}^2}standard deviation=n∑x2−xˉ2The value ∑x2\sum x^2∑x2 means “square each data value, then add the squares”.
Example
Using summary statistics to find the mean and standard deviation
For a group of 80 employees, the travel times to work have summary statistics:
n=80,∑x=3440,∑x2=163200n=80,\qquad \sum x=3440,\qquad \sum x^2=163200n=80,∑x=3440,∑x2=163200Find the mean and standard deviation.
-
Find the mean using xˉ=∑xn\bar{x}=\frac{\sum x}{n}xˉ=n∑x.
xˉ=344080=43\bar{x}=\frac{3440}{80}=43xˉ=803440=43 -
Substitute into the standard deviation formula.
sd=16320080−432\text{sd}=\sqrt{\frac{163200}{80}-43^2}sd=80163200−432 -
Simplify inside the square root.
sd=2040−1849\text{sd}=\sqrt{2040-1849}sd=2040−1849 -
Calculate the standard deviation.
sd=191=13.820…\text{sd}=\sqrt{191}=13.820\ldotssd=191=13.820… -
Give a sensible rounded answer: the mean is 43 minutes and the standard deviation is 13.8 minutes.
Tip
Calculator check
On your calculator, the standard deviation with divisor nnn is usually labelled σx\sigma_xσx. Avoid using the sample standard deviation unless the question specifically asks for it.
4. Using SxxS_{xx}Sxx
Sometimes you are given SxxS_{xx}Sxx instead of ∑x2\sum x^2∑x2.
Definition
What means
The statistic SxxS_{xx}Sxx measures the total squared variation from the mean:
Sxx=∑x2−(∑x)2nS_{xx}=\sum x^2-\frac{(\sum x)^2}{n}Sxx=∑x2−n(∑x)2So the standard deviation is
sd=Sxxn\text{sd}=\sqrt{\frac{S_{xx}}{n}}sd=nSxxExample
Finding standard deviation from
A survey of 70 staff gives
n=70,∑x=1890,Sxx=5670n=70,\qquad \sum x=1890,\qquad S_{xx}=5670n=70,∑x=1890,Sxx=5670Find the mean and standard deviation.
-
Use xˉ=∑xn\bar{x}=\frac{\sum x}{n}xˉ=n∑x.
xˉ=189070=27\bar{x}=\frac{1890}{70}=27xˉ=701890=27 -
Use the formula involving SxxS_{xx}Sxx.
sd=567070\text{sd}=\sqrt{\frac{5670}{70}}sd=705670 -
Calculate.
sd=81=9\text{sd}=\sqrt{81}=9sd=81=9 -
The mean is 27 and the standard deviation is 9.
5. Grouped data and midpoints
When data are grouped into classes, you usually do not know the exact original values. So the mean and standard deviation are estimates.
For each class, use the class midpoint as a representative value.
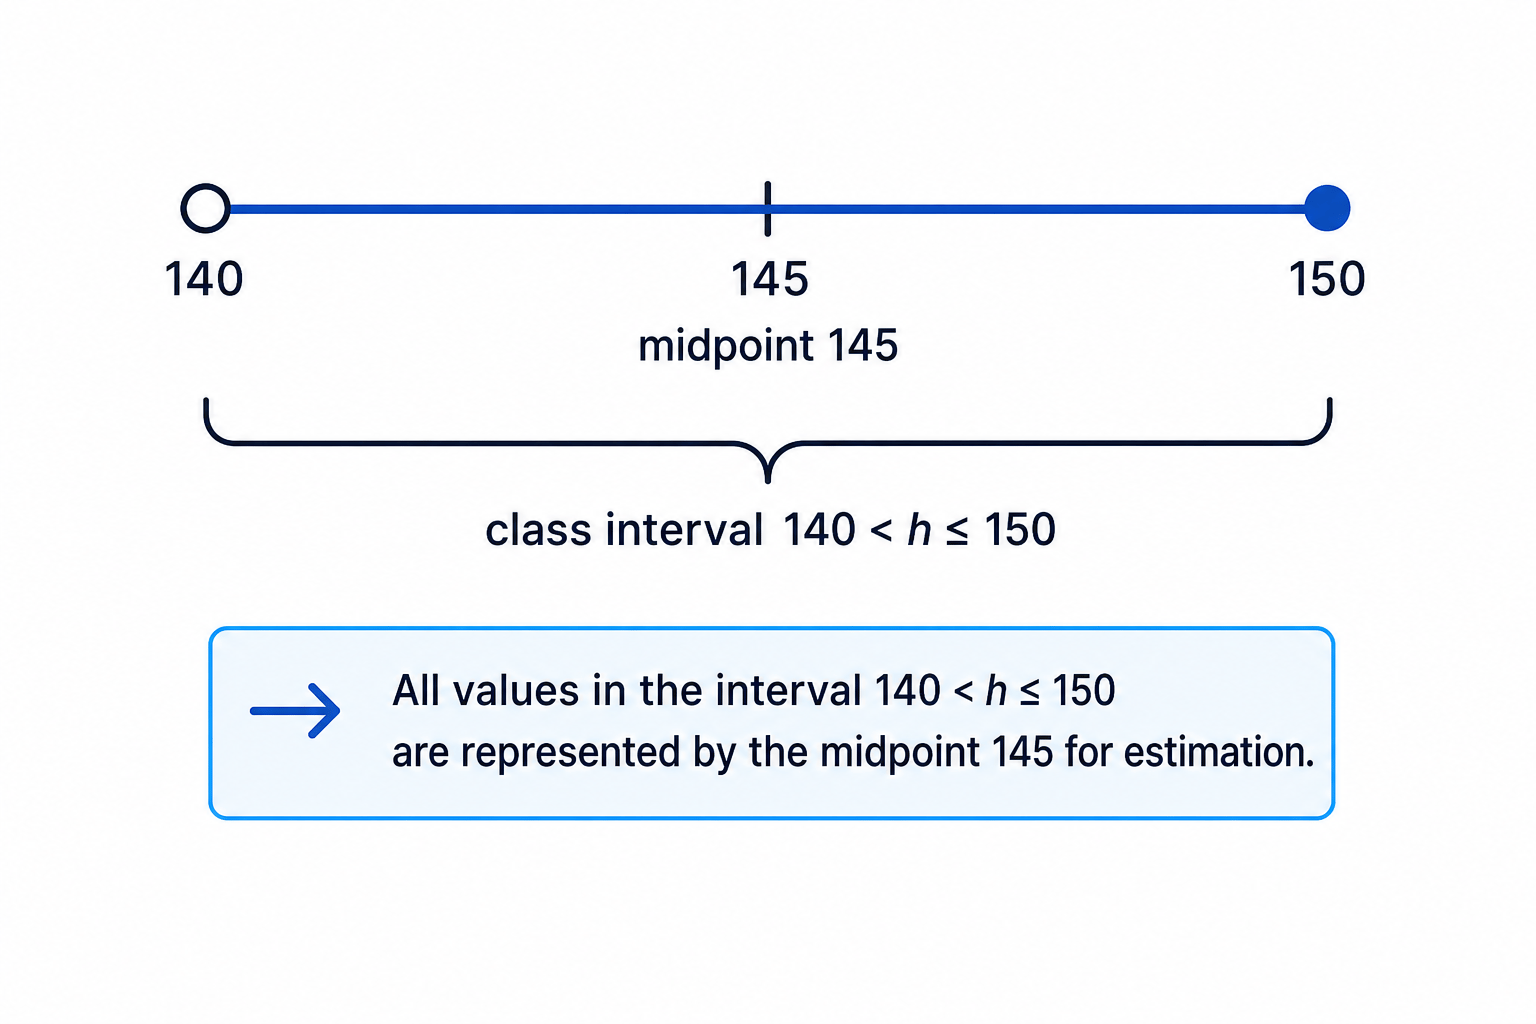
For example, the midpoint of 140<h≤150140<h\le150140<h≤150 is
140+1502=145\frac{140+150}{2}=1452140+150=145Example
Estimating the mean and standard deviation from grouped heights
A gardener records the heights of 50 plants:
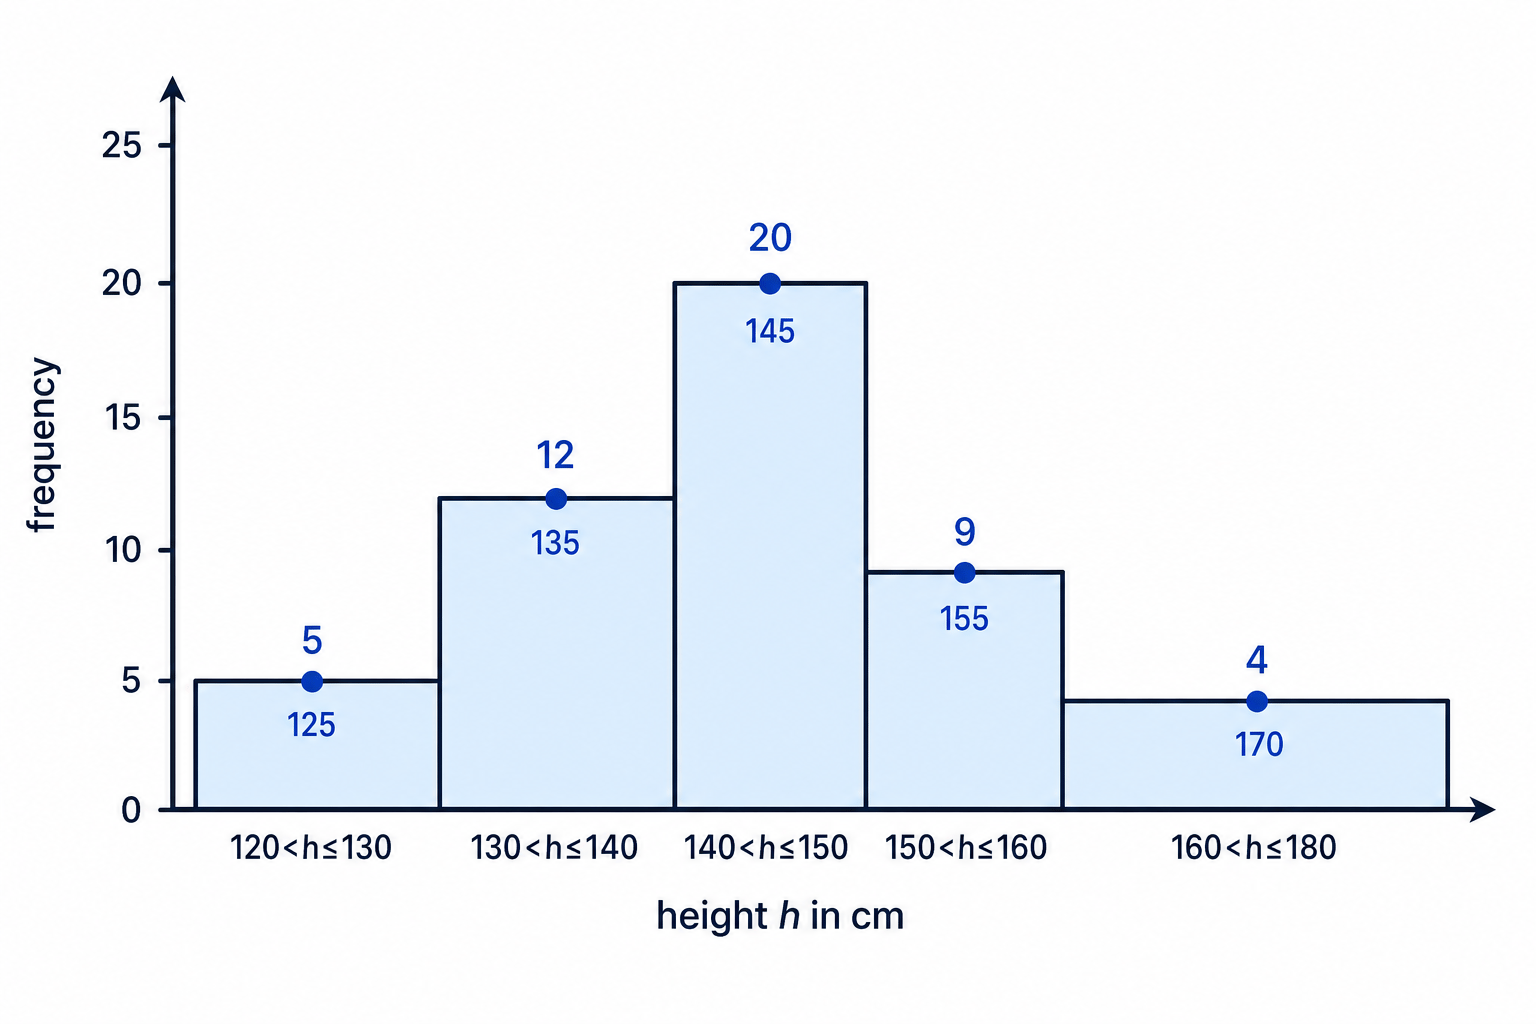
- 120<h≤130120<h\le130120<h≤130: frequency 5
- 130<h≤140130<h\le140130<h≤140: frequency 12
- 140<h≤150140<h\le150140<h≤150: frequency 20
- 150<h≤160150<h\le160150<h≤160: frequency 9
- 160<h≤180160<h\le180160<h≤180: frequency 4
Estimate the mean and standard deviation.
-
Find the class midpoints: 125, 135, 145, 155 and 170.
-
Multiply each midpoint by its frequency, then add.
∑fx=5(125)+12(135)+20(145)+9(155)+4(170)=7220\sum fx=5(125)+12(135)+20(145)+9(155)+4(170)=7220∑fx=5(125)+12(135)+20(145)+9(155)+4(170)=7220 -
Divide by the total frequency.
xˉ=722050=144.4\bar{x}=\frac{7220}{50}=144.4xˉ=507220=144.4 -
Now find ∑fx2\sum fx^2∑fx2 by squaring each midpoint first.
∑fx2=5(1252)+12(1352)+20(1452)+9(1552)+4(1702)=1049150\sum fx^2=5(125^2)+12(135^2)+20(145^2)+9(155^2)+4(170^2)=1049150∑fx2=5(1252)+12(1352)+20(1452)+9(1552)+4(1702)=1049150 -
Substitute into the grouped standard deviation formula.
sd=104915050−144.42\text{sd}=\sqrt{\frac{1049150}{50}-144.4^2}sd=501049150−144.42 -
Calculate.
sd=11.47…\text{sd}=11.47\ldotssd=11.47… -
The estimated mean is 144.4 cm and the estimated standard deviation is about 11.5 cm.
Common Mistake
Squaring the frequency
For ∑fx2\sum fx^2∑fx2, square the midpoint, not the frequency. The calculation is frequency times midpoint squared.
6. Linear interpolation for the median
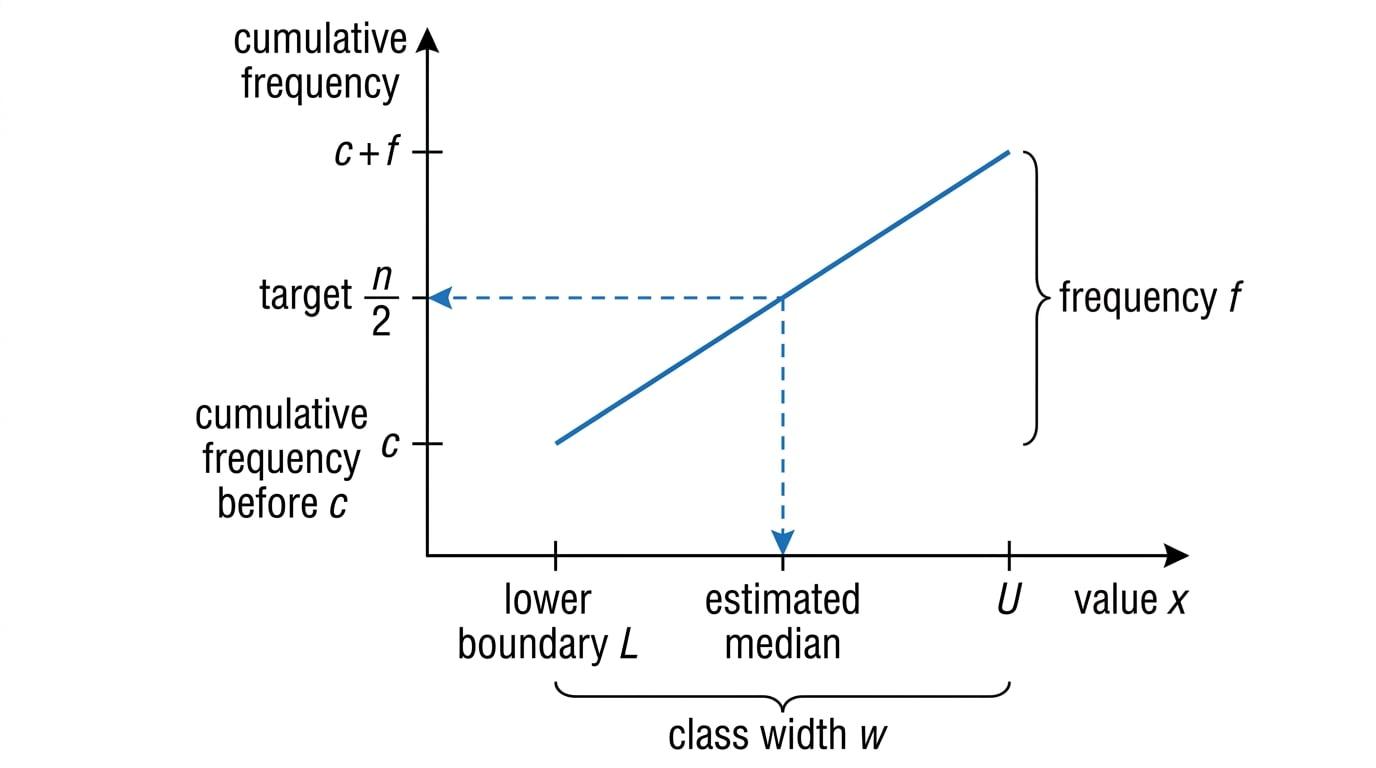
For grouped data, the median is also an estimate. We assume the data are evenly spread within the median class. This method is called linear interpolation.
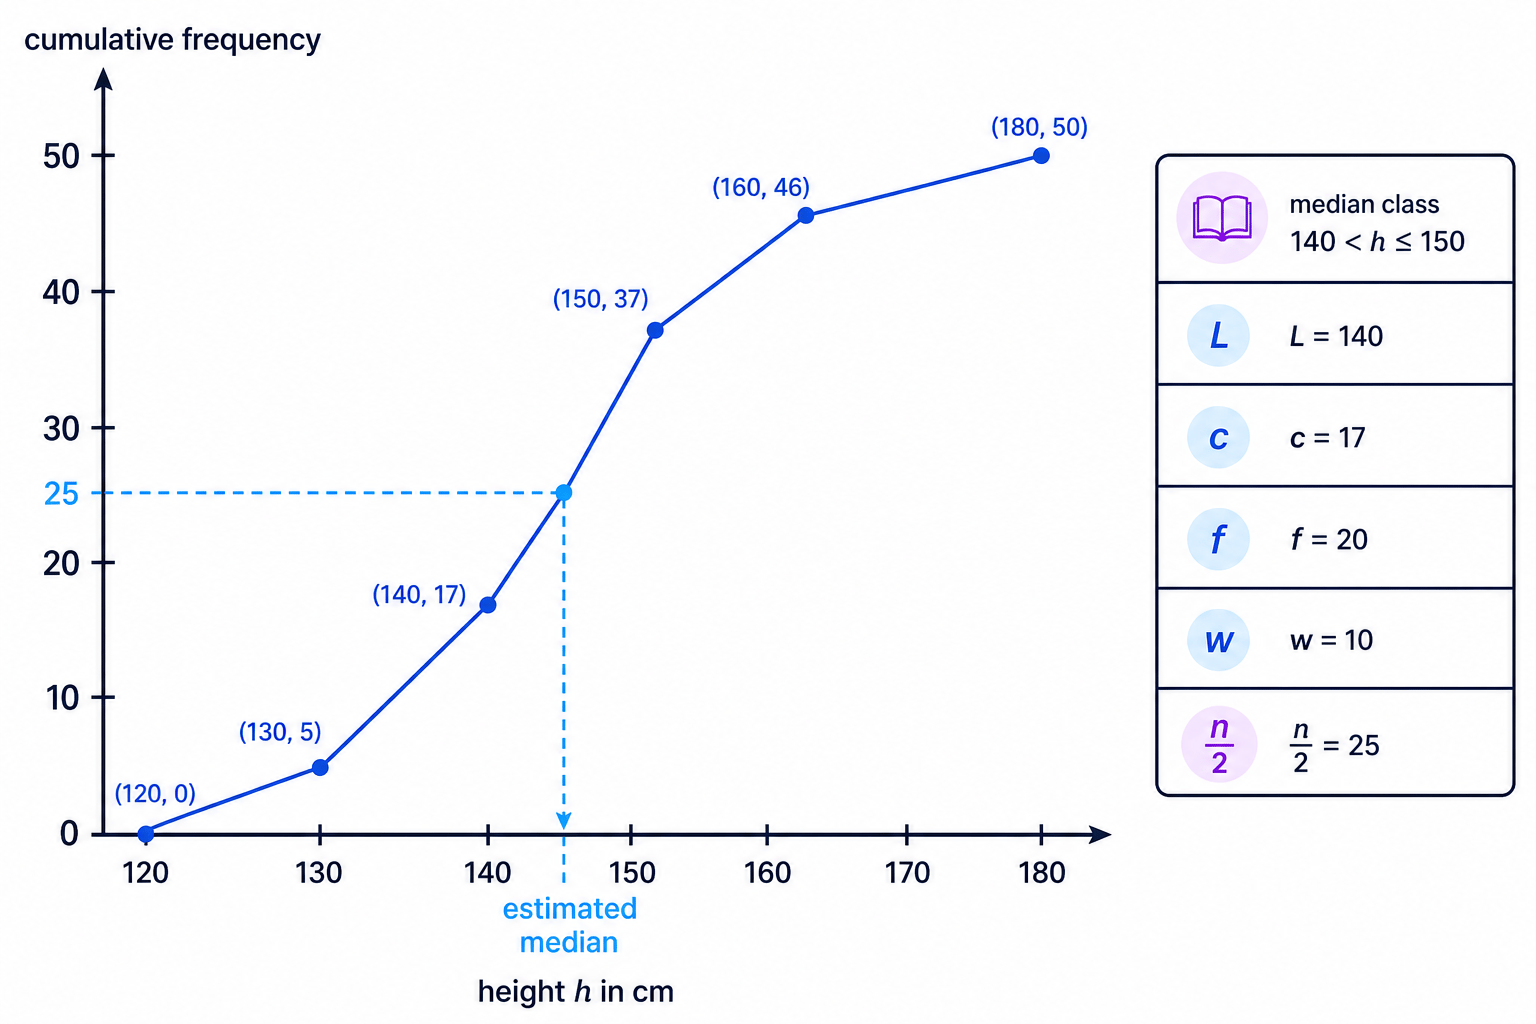
The picture below shows the idea: you locate the halfway position, then move proportionally through the median class.
Definition
Linear interpolation formula
For grouped data,
median=L+n2−cf×w\text{median}=L+\frac{\frac{n}{2}-c}{f}\times wmedian=L+f2n−c×wwhere:
- LLL is the lower boundary of the median class.
- nnn is the total frequency.
- ccc is the cumulative frequency before the median class.
- fff is the frequency of the median class.
- www is the class width.
Example
Estimating a grouped median
Use the plant-height data from before:
- 120<h≤130120<h\le130120<h≤130: frequency 5
- 130<h≤140130<h\le140130<h≤140: frequency 12
- 140<h≤150140<h\le150140<h≤150: frequency 20
- 150<h≤160150<h\le160150<h≤160: frequency 9
- 160<h≤180160<h\le180160<h≤180: frequency 4
Estimate the median height.
-
Find the total frequency.
n=5+12+20+9+4=50n=5+12+20+9+4=50n=5+12+20+9+4=50 -
The median is at position n2=25\frac{n}{2}=252n=25.
-
Find cumulative frequencies: 5, 17, 37, 46, 50.
-
The 25th value lies in the class 140<h≤150140<h\le150140<h≤150, because the cumulative frequency goes from 17 to 37 there.
-
Identify the interpolation values: L=140L=140L=140, c=17c=17c=17, f=20f=20f=20, and w=10w=10w=10.
-
Substitute into the formula.
median=140+25−1720×10\text{median}=140+\frac{25-17}{20}\times10median=140+2025−17×10 -
Calculate.
median=144\text{median}=144median=144 -
The estimated median height is 144 cm.
Common Mistake
Class boundaries matter
If data are recorded to the nearest mile, a class labelled 20–29 actually runs from 19.5 to 29.5 for interpolation. Use the real class boundaries, not just the printed labels.
7. Coding data
Sometimes data are coded to make the numbers easier to handle. For example,
x=t−202x=\frac{t-20}{2}x=2t−20means the original value ttt has had 20 subtracted, then been divided by 2.
To undo the coding, rearrange the formula:
t=2x+20t=2x+20t=2x+20Key Idea
How coding affects measures
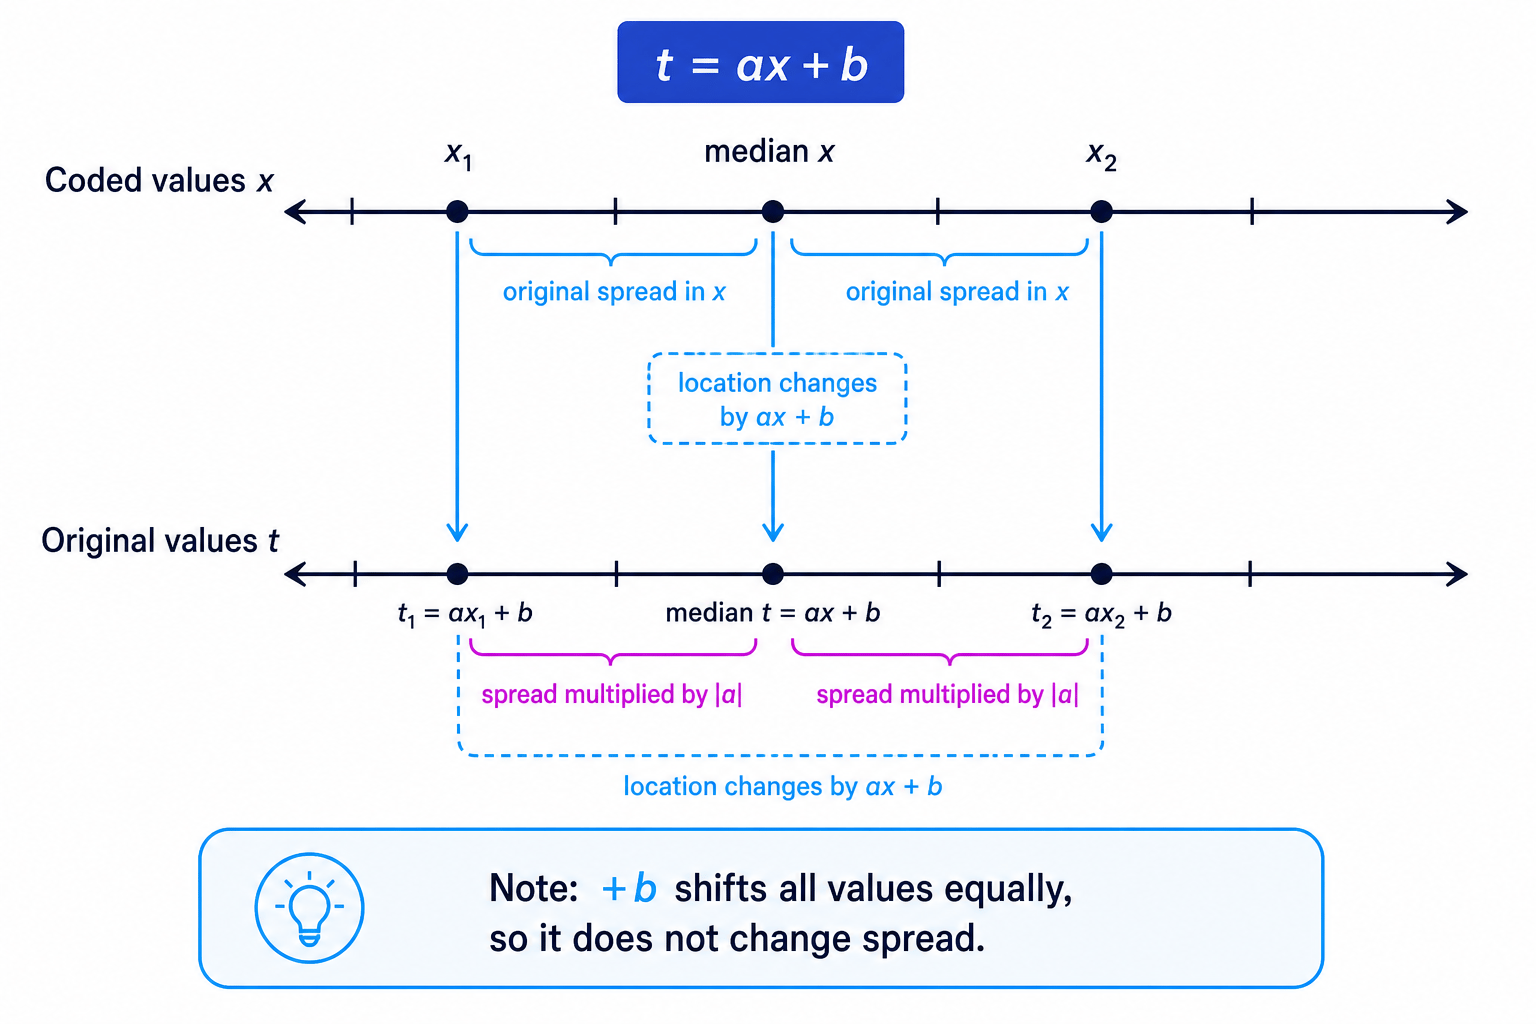
If t=ax+bt=ax+bt=ax+b, then measures of location, such as the mean and median, become aaa times as large and then have bbb added. Standard deviation is only multiplied by ∣a∣|a|∣a∣ because adding a constant does not change spread.
Example
Undoing coding for median and standard deviation
For coded travel times xxx, the estimated median is 14.2 and the estimated standard deviation is 8.1. The coding used was
x=t−202x=\frac{t-20}{2}x=2t−20Find the median and standard deviation of the original times ttt.
-
Rearrange the coding formula.
t=2x+20t=2x+20t=2x+20 -
Transform the median using the full formula.
median of t=2(14.2)+20=48.4\text{median of }t=2(14.2)+20=48.4median of t=2(14.2)+20=48.4 -
Transform the standard deviation by multiplying by 2 only.
sd of t=2(8.1)=16.2\text{sd of }t=2(8.1)=16.2sd of t=2(8.1)=16.2 -
The original median is 48.4 minutes and the original standard deviation is 16.2 minutes.
Common Mistake
Adding to the standard deviation
Do not add 20 to the standard deviation. Adding a constant shifts every value by the same amount, so the spread stays the same.
Exam technique
In the exam
-
For raw data, order the values before finding the median or quartiles.
-
For grouped means and standard deviations, use midpoints and remember your answers are estimates.
-
For interpolation, identify LLL, ccc, fff, www and n2\frac{n}{2}2n before substituting.
-
For coding, undo the formula carefully; multiply standard deviation by the scale factor only.
Self review
Check yourself
-
Can you explain the difference between the mean and the median?
-
When estimating a grouped mean, why do you use class midpoints?
-
If x=t−105x=\frac{t-10}{5}x=5t−10, what happens to the standard deviation when you convert from xxx back to ttt?

Recap questions
Test yourself with 5 quick questions on this guide. Answer them all correctly to complete it.
You've reached the end
Test yourself on this topic, or move on to the next guide.
How was this guide?