Revision notes for Edexcel AS Level Maths Graphs and Transformations. Open each subtopic for explanations, worked examples, and summaries of 4.1 Cubic Graphs, 4.2 Quartic Graphs, 4.3 Reciprocal Graphs, 4.4 Points of Intersection, 4.5 Translating Graphs, 4.6 Stretching Graphs, and 4.7 Transforming Functions. Written against the Edexcel AS Level Maths (8MA0) specification, so the content matches what's examinable rather than general Maths background.
Graphs and Transformations
What you'll learn
- How to sketch polynomial and reciprocal graphs from their equations.
- How to find and label intercepts, roots, turning points and asymptotes.
- How transformations such as f(x)+af(x)+af(x)+a, f(x−a)f(x-a)f(x−a), −f(x)-f(x)−f(x) and f(ax)f(ax)f(ax) change a graph.
- How to use a sketch to solve equations and inequalities.
1. Reading a graph: the essential vocabulary
A graph is a picture of all the points (x,y)(x, y)(x,y) that satisfy an equation, such as y=f(x)y=f(x)y=f(x).
Definition
Intercepts, roots and asymptotes
- An x-intercept is where a graph crosses or touches the x-axis, so y=0y=0y=0.
- A y-intercept is where a graph crosses the y-axis, so x=0x=0x=0.
- A root or zero of f(x)f(x)f(x) is a value of xxx where f(x)=0f(x)=0f(x)=0.
- An asymptote is a straight line that a curve gets closer and closer to but does not meet.
For factorised polynomial graphs, the roots are usually the easiest part. If
f(x)=(x+2)(x−1)(3−x)f(x)=(x+2)(x-1)(3-x)f(x)=(x+2)(x−1)(3−x)then the x-intercepts come from setting each factor equal to zero.
Cubic graph shape
A cubic is a polynomial with highest power x3x^3x3. Its end behaviour depends on the sign of the x3x^3x3 coefficient:
- positive x3x^3x3 coefficient: down on the left, up on the right
- negative x3x^3x3 coefficient: up on the left, down on the right
If a factor is repeated, for example (x−2)2(x-2)^2(x−2)2, the graph usually touches the x-axis at that root rather than crossing it.
Example
Sketching a factorised cubic
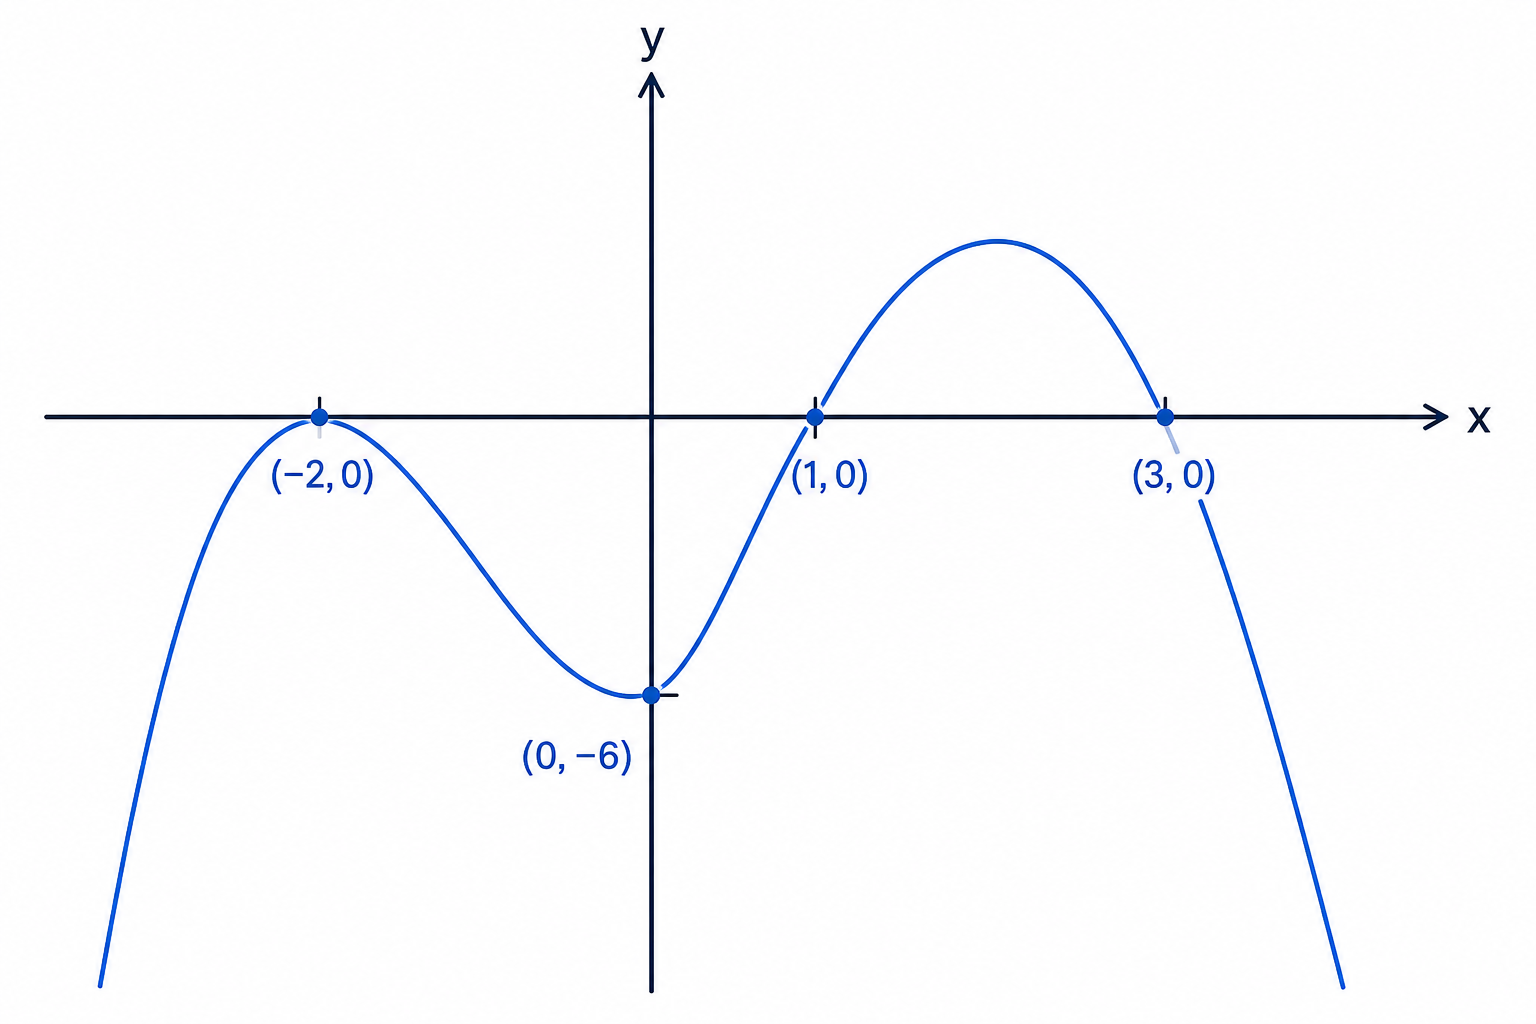
Sketch y=(x+2)(x−1)(3−x)y=(x+2)(x-1)(3-x)y=(x+2)(x−1)(3−x), showing where it meets the coordinate axes.
-
Find the x-intercepts by setting each factor equal to zero.
x+2=0⇒x=−2x−1=0⇒x=13−x=0⇒x=3\begin{aligned} x+2&=0 \Rightarrow x=-2\\ x-1&=0 \Rightarrow x=1\\ 3-x&=0 \Rightarrow x=3 \end{aligned}x+2x−13−x=0⇒x=−2=0⇒x=1=0⇒x=3 -
Write the x-intercepts as coordinates.
(−2,0),(1,0),(3,0)(-2,0),\quad (1,0),\quad (3,0)(−2,0),(1,0),(3,0) -
Find the y-intercept by substituting x=0x=0x=0.
y=(0+2)(0−1)(3−0)=2×(−1)×3=−6y=(0+2)(0-1)(3-0)=2 \times (-1)\times 3=-6y=(0+2)(0−1)(3−0)=2×(−1)×3=−6 -
Decide the overall cubic shape. The leading term is negative, because x×x×(−x)=−x3x \times x \times (-x)=-x^3x×x×(−x)=−x3, so the curve goes up on the left and down on the right.
-
Draw a smooth cubic crossing the x-axis at x=−2x=-2x=−2, x=1x=1x=1 and x=3x=3x=3, and crossing the y-axis at (0,−6)(0,-6)(0,−6).
Tip
Sketch before you perfect
In sketch questions, the shape and labelled intercepts are usually worth more than scale accuracy. Your graph does not need squared-paper precision unless the question asks for it.
2. Function notation and transformations
Definition
Function notation
Writing y=f(x)y=f(x)y=f(x) means that the y-value is found by putting xxx into a rule called fff. For example, if f(x)=x2+3f(x)=x^2+3f(x)=x2+3, then f(2)=7f(2)=7f(2)=7.
A transformation changes the position or shape of a graph. In this topic, the main transformations are translations, reflections and stretches.
- A translation slides every point by the same amount.
- A reflection flips a graph in a mirror line, usually an axis.
- A stretch multiplies distances from an axis by a scale factor.
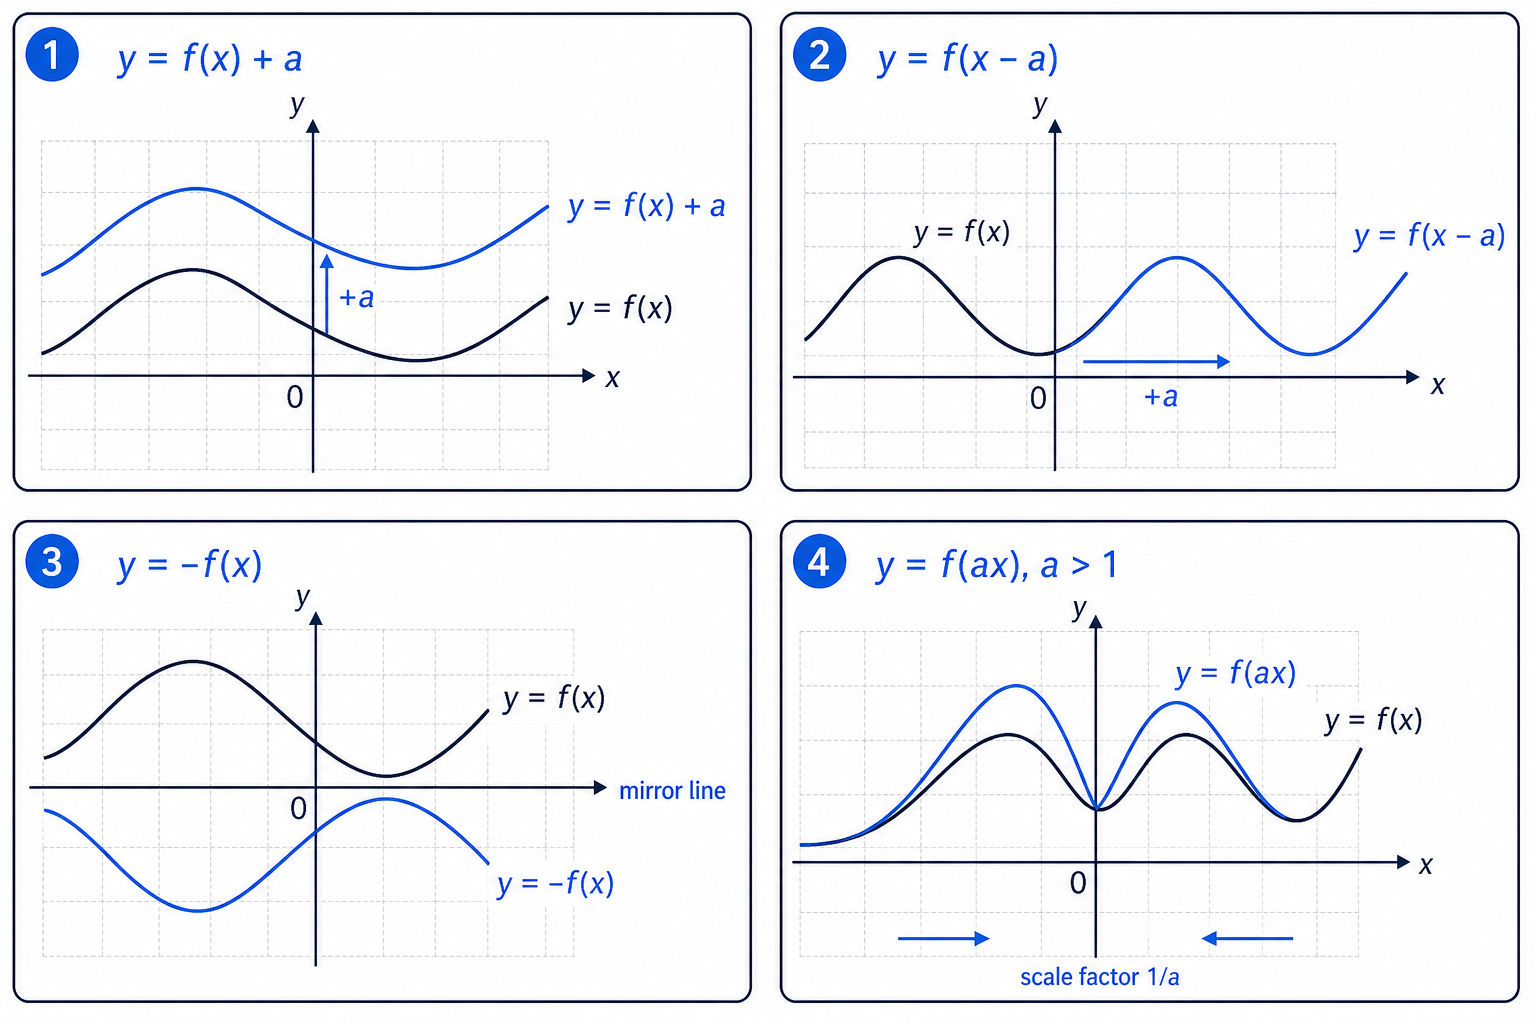
The diagram below shows the big idea: outside the function affects the y-values; inside the function affects the x-values.

Key transformation rules
For a point (x,y)(x,y)(x,y) on y=f(x)y=f(x)y=f(x):
- y=f(x)+ay=f(x)+ay=f(x)+a moves the graph up by aaa.
- y=f(x)−ay=f(x)-ay=f(x)−a moves the graph down by aaa.
- y=f(x−a)y=f(x-a)y=f(x−a) moves the graph right by aaa.
- y=f(x+a)y=f(x+a)y=f(x+a) moves the graph left by aaa.
- y=−f(x)y=-f(x)y=−f(x) reflects the graph in the x-axis.
- y=f(−x)y=f(-x)y=f(−x) reflects the graph in the y-axis.
- y=af(x)y=af(x)y=af(x) is a stretch parallel to the y-axis, scale factor aaa.
- y=f(ax)y=f(ax)y=f(ax) is a stretch parallel to the x-axis, scale factor 1a\frac{1}{a}a1.
Key Idea
Outside vs inside
Changes outside the bracket affect y-values in the obvious way. Changes inside the bracket affect x-values in the opposite way.
Common Mistake
Moving the wrong way
The graph of y=f(x−3)y=f(x-3)y=f(x−3) moves right by 3, not left. Think: to get the same output as f(0)f(0)f(0), you need x−3=0x-3=0x−3=0, so x=3x=3x=3.
Example
Transforming labelled points
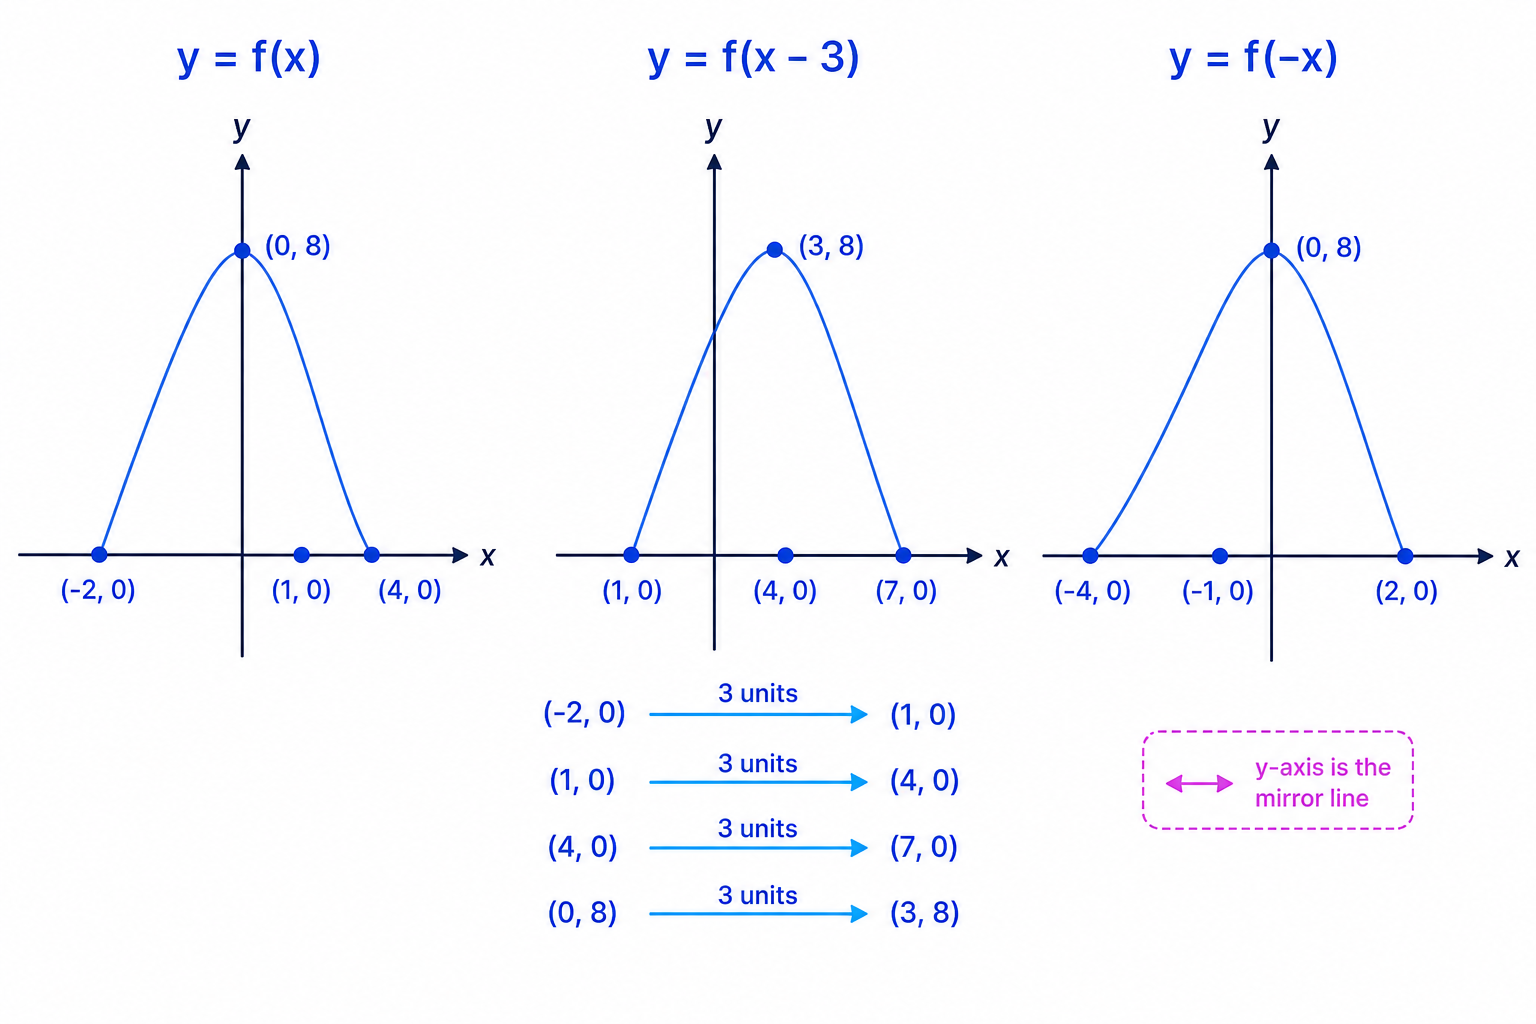
A curve y=f(x)y=f(x)y=f(x) passes through (−2,0)(-2,0)(−2,0), (1,0)(1,0)(1,0), (4,0)(4,0)(4,0) and (0,8)(0,8)(0,8). Find the corresponding points on y=f(x−3)y=f(x-3)y=f(x−3) and y=f(−x)y=f(-x)y=f(−x).
-
For y=f(x−3)y=f(x-3)y=f(x−3), the graph moves 3 units to the right. Add 3 to every x-coordinate.
(−2,0)→(1,0),(1,0)→(4,0),(4,0)→(7,0),(0,8)→(3,8)(-2,0)\to(1,0),\quad (1,0)\to(4,0),\quad (4,0)\to(7,0),\quad (0,8)\to(3,8)(−2,0)→(1,0),(1,0)→(4,0),(4,0)→(7,0),(0,8)→(3,8) -
For y=f(−x)y=f(-x)y=f(−x), the graph reflects in the y-axis. Change the sign of every x-coordinate.
(−2,0)→(2,0),(1,0)→(−1,0),(4,0)→(−4,0),(0,8)→(0,8)(-2,0)\to(2,0),\quad (1,0)\to(-1,0),\quad (4,0)\to(-4,0),\quad (0,8)\to(0,8)(−2,0)→(2,0),(1,0)→(−1,0),(4,0)→(−4,0),(0,8)→(0,8) -
Notice that the y-intercept stays on the y-axis under y=f(−x)y=f(-x)y=f(−x), because its x-coordinate is zero.
3. Quadratics: completing the square and minimum points
A quadratic has highest power x2x^2x2. If the coefficient of x2x^2x2 is positive, it has a minimum point.
Completing the square rewrites a quadratic in the form
(x+a)2+b(x+a)^2+b(x+a)2+bThis makes the turning point easier to read.
Example
Minimum point and transformed minimum points
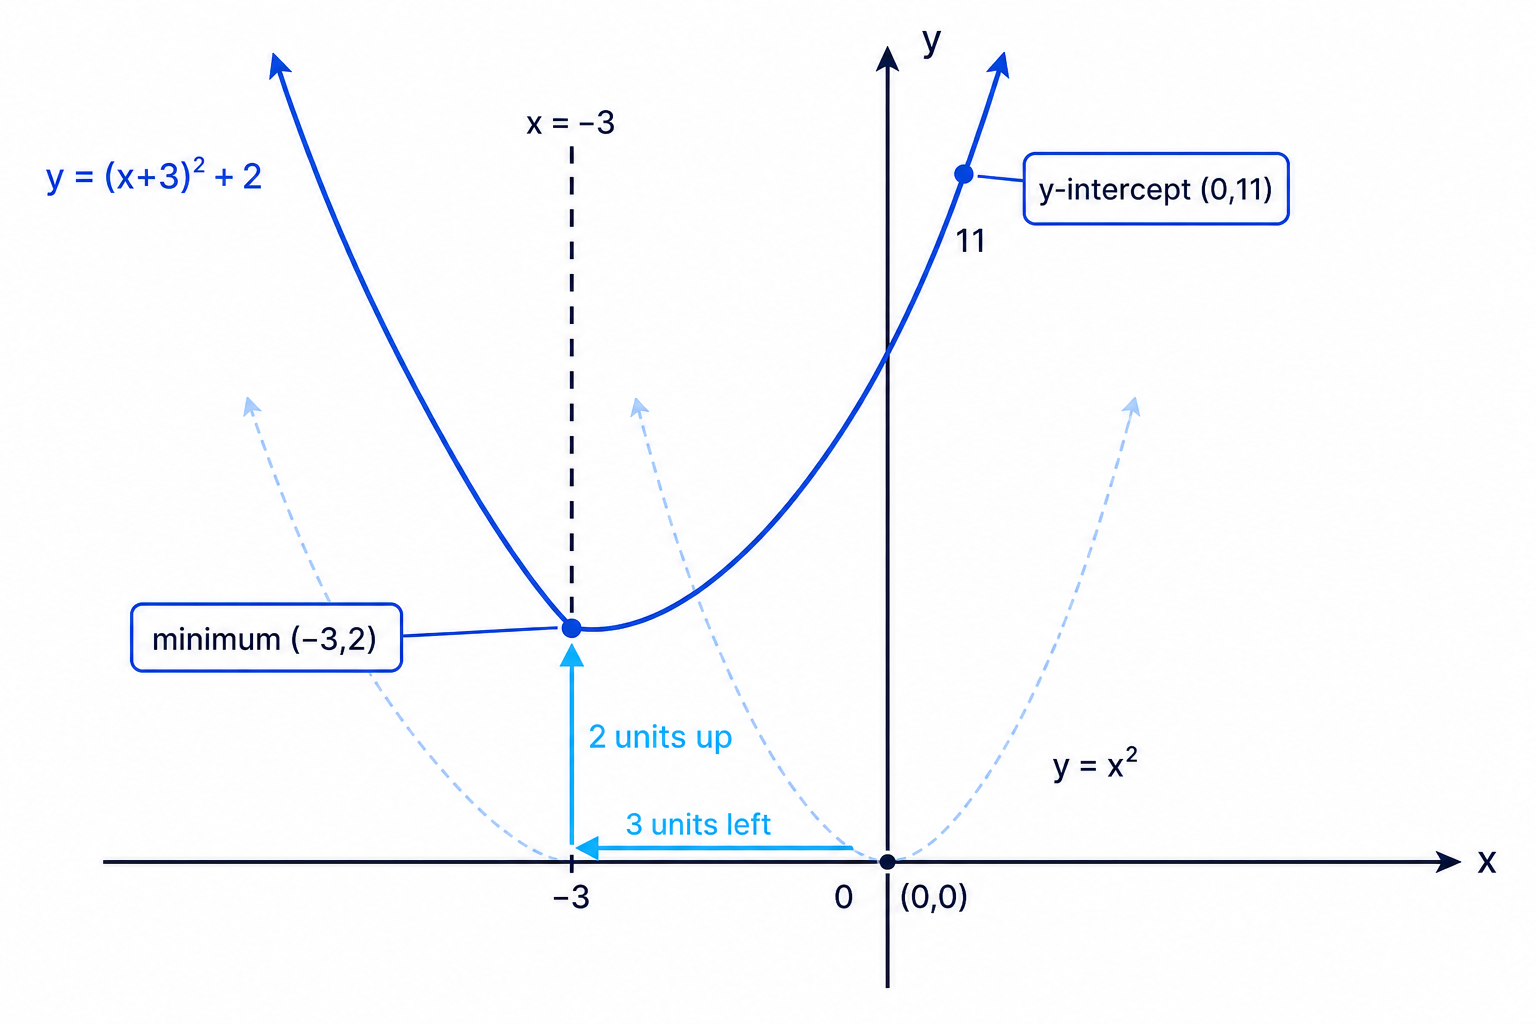
Let f(x)=x2+6x+11f(x)=x^2+6x+11f(x)=x2+6x+11.
-
Complete the square.
f(x)=x2+6x+11=(x+3)2−9+11=(x+3)2+2\begin{aligned} f(x)&=x^2+6x+11\\ &=(x+3)^2-9+11\\ &=(x+3)^2+2 \end{aligned}f(x)=x2+6x+11=(x+3)2−9+11=(x+3)2+2 -
Read off the minimum point. Since (x+3)2(x+3)^2(x+3)2 is smallest when x=−3x=-3x=−3, the minimum point is (−3,2)(-3,2)(−3,2).
-
For y=2f(x)y=2f(x)y=2f(x), all y-values are doubled. The minimum point becomes (−3,4)(-3,4)(−3,4).
-
For y=f(2x)y=f(2x)y=f(2x), the graph is stretched parallel to the x-axis with scale factor 12\frac{1}{2}21. Halve the x-coordinate, so the minimum point becomes (−32,2)\left(-\frac{3}{2},2\right)(−23,2).
Common Mistake
Stretches do not always move both coordinates
For y=2f(x)y=2f(x)y=2f(x), only y-values change. For y=f(2x)y=f(2x)y=f(2x), only x-values change. Do not double or halve both coordinates.
4. Reciprocal graphs and asymptotes
The basic reciprocal graph y=1xy=\frac{1}{x}y=x1 has two branches. It has:
- vertical asymptote x=0x=0x=0
- horizontal asymptote y=0y=0y=0
Translations move the asymptotes as well as the curve.
For example, y=1x−2+1y=\frac{1}{x-2}+1y=x−21+1 is y=1xy=\frac{1}{x}y=x1 translated 2 units right and 1 unit up.

Example
Sketching a translated reciprocal graph
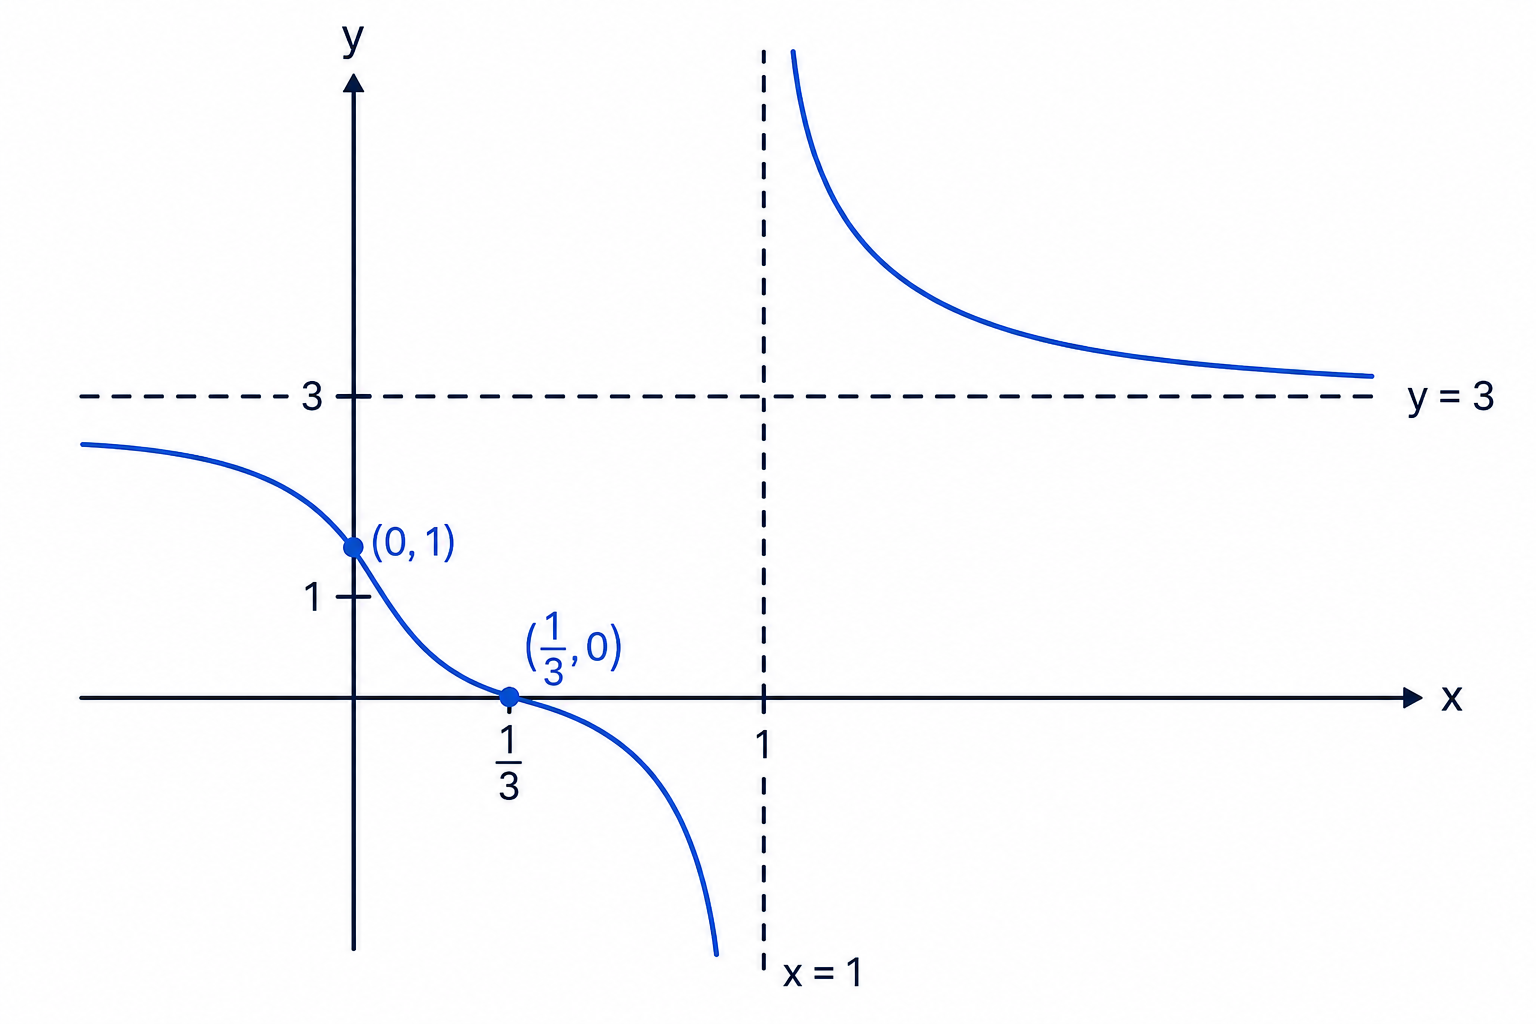
Sketch y=2x−1+3y=\frac{2}{x-1}+3y=x−12+3, giving the intercepts and asymptotes.
-
Find the vertical asymptote from the denominator.
x−1=0⇒x=1x-1=0 \Rightarrow x=1x−1=0⇒x=1 -
Find the horizontal asymptote from the vertical shift. Since 3 is added outside the fraction, the horizontal asymptote is y=3y=3y=3.
-
Find the y-intercept by substituting x=0x=0x=0.
y=20−1+3=−2+3=1y=\frac{2}{0-1}+3=-2+3=1y=0−12+3=−2+3=1 -
Find the x-intercept by setting y=0y=0y=0.
0=2x−1+3−3=2x−1−3(x−1)=2−3x+3=2x=13\begin{aligned} 0&=\frac{2}{x-1}+3\\ -3&=\frac{2}{x-1}\\ -3(x-1)&=2\\ -3x+3&=2\\ x&=\frac{1}{3} \end{aligned}0−3−3(x−1)−3x+3x=x−12+3=x−12=2=2=31 -
Label the intercepts (0,1)(0,1)(0,1) and (13,0)\left(\frac{1}{3},0\right)(31,0), then draw two branches approaching x=1x=1x=1 and y=3y=3y=3.
5. Using sketches for equations and inequalities
A graph can help you solve equations and inequalities.
- Solving f(x)=0f(x)=0f(x)=0 means finding where the graph meets the x-axis.
- Solving f(x)>0f(x)>0f(x)>0 means finding where the graph is above the x-axis.
- Solving f(x)≤0f(x)\leq 0f(x)≤0 means finding where the graph is on or below the x-axis.
Example
Solving an inequality from a cubic sketch
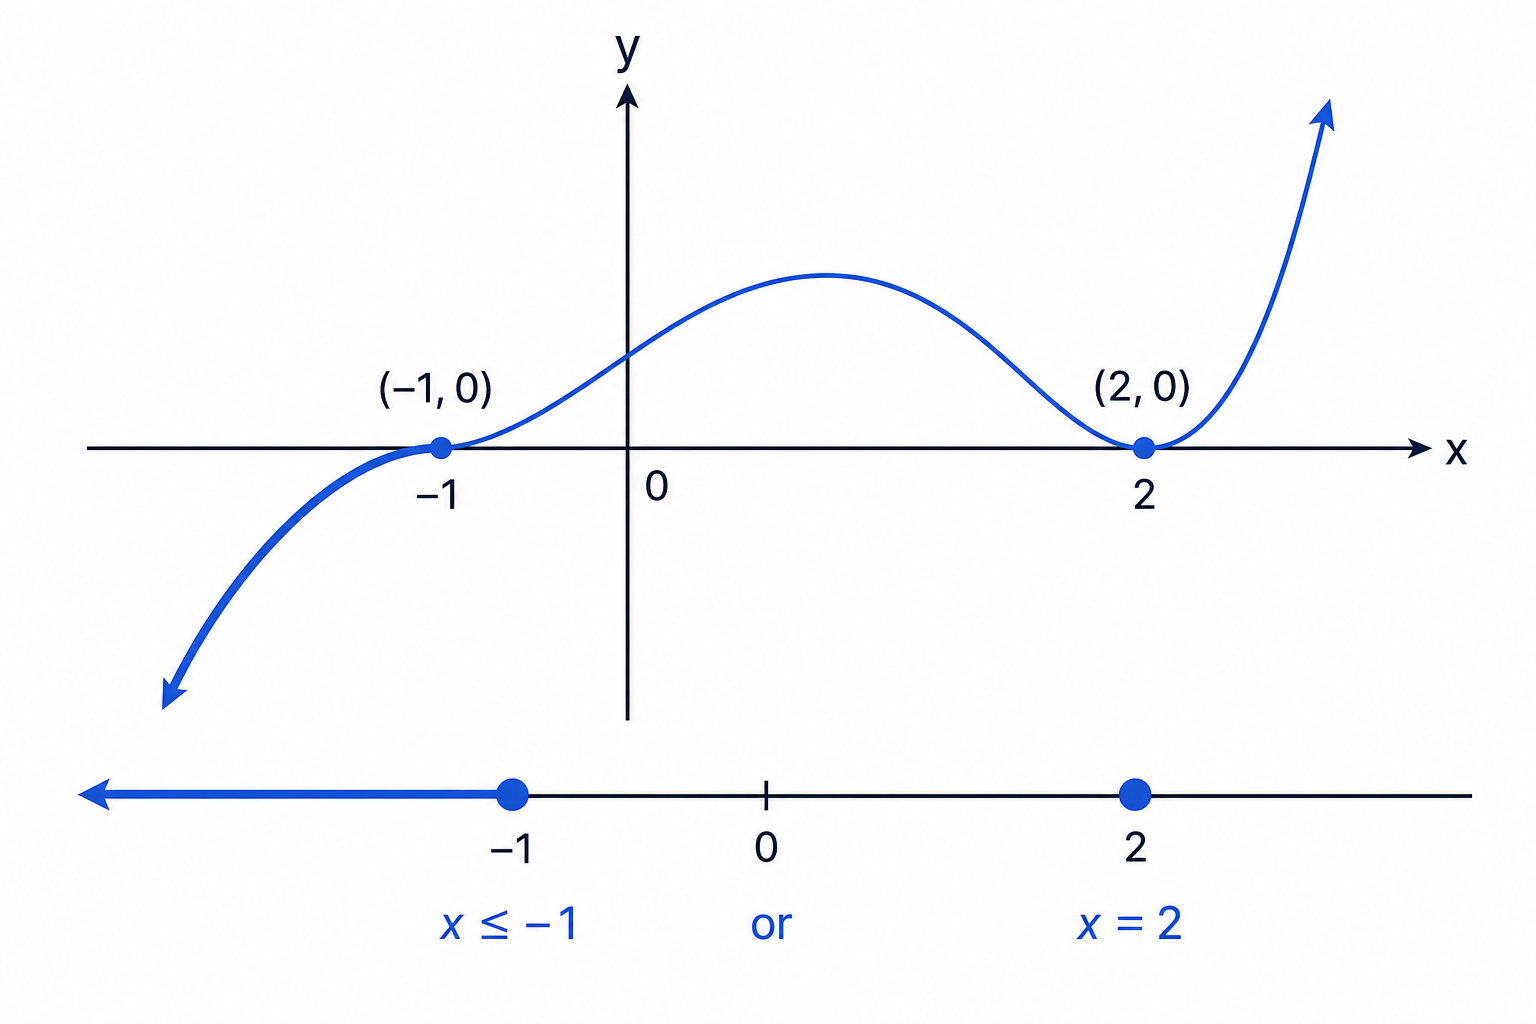
Let f(x)=(x+1)(x−2)2f(x)=(x+1)(x-2)^2f(x)=(x+1)(x−2)2. Use the graph to solve f(x)≤0f(x)\leq 0f(x)≤0.
-
Find the roots.
x=−1,x=2x=-1,\quad x=2x=−1,x=2 -
Notice that x=2x=2x=2 is a repeated root because of (x−2)2(x-2)^2(x−2)2, so the graph touches the x-axis there.
-
Work out the overall shape. The leading term is positive, so the cubic goes down on the left and up on the right.
-
Decide where the graph is on or below the x-axis. It is below the axis to the left of x=−1x=-1x=−1, crosses at x=−1x=-1x=−1, then stays above the axis except for touching at x=2x=2x=2.
-
Write the solution in set notation.
{x:x≤−1}∪{2}\{x:x\leq -1\}\cup\{2\}{x:x≤−1}∪{2}
Tip
Repeated roots and inequalities
At an even repeated root, the graph touches the x-axis and turns around. The sign of f(x)f(x)f(x) usually does not change there.
6. Equations from intersections
If two graphs intersect, their y-values are equal at the intersection points. So the number of real solutions to an equation can often be read from the number of intersections.
Example
Counting real solutions by sketching
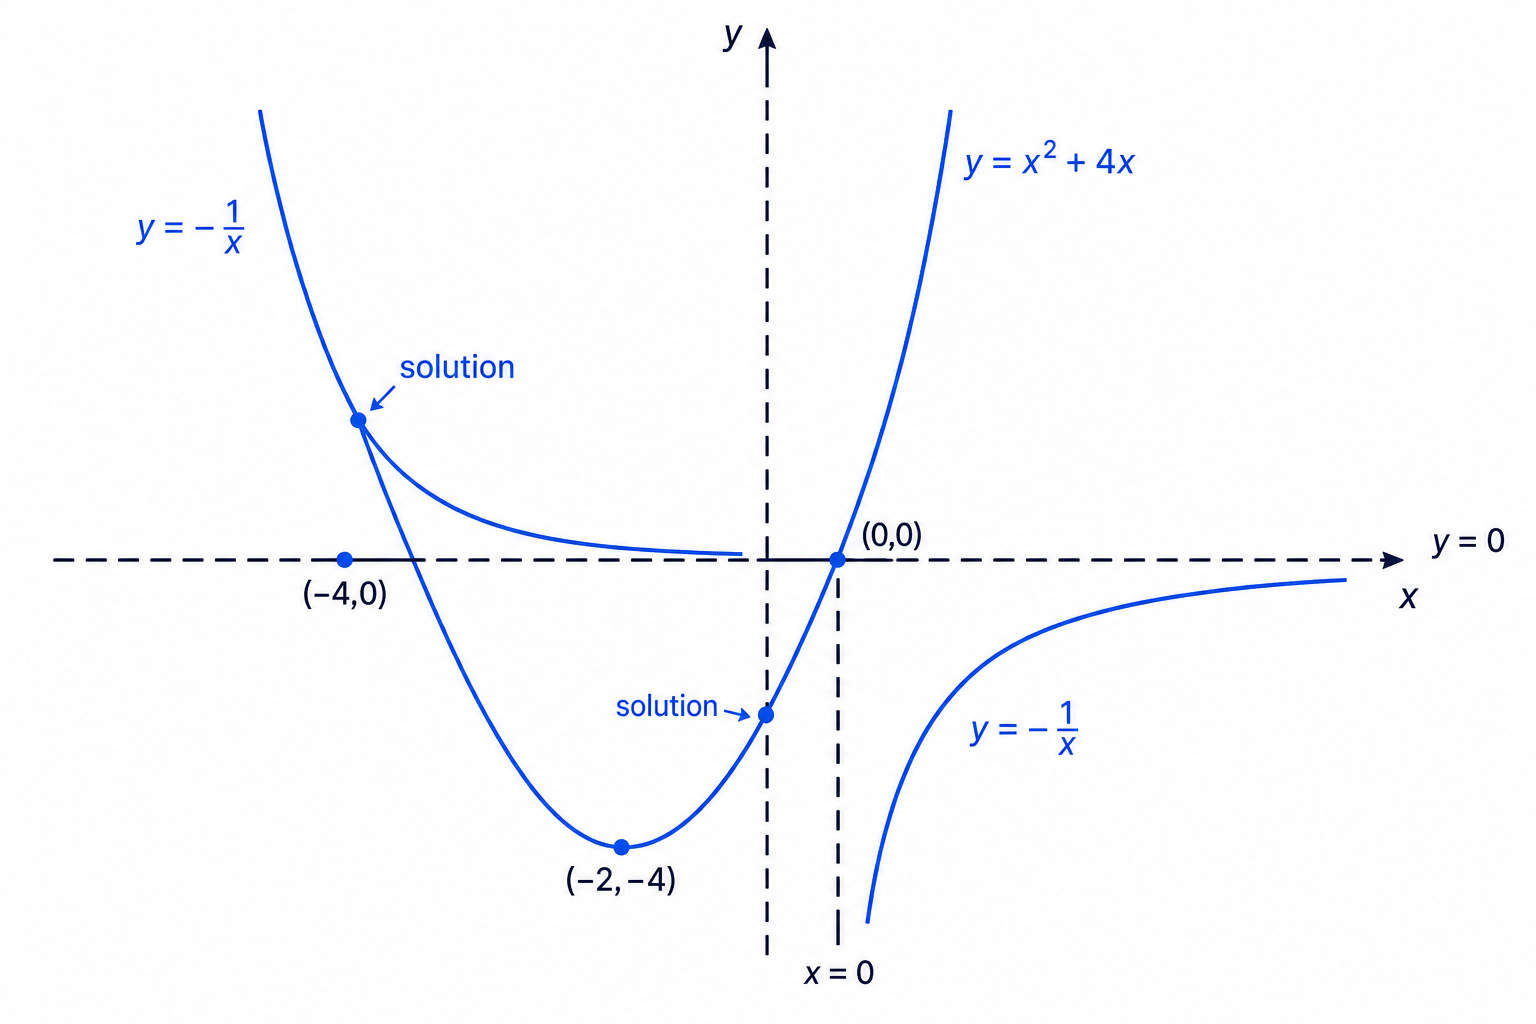
Sketch ideas are enough to state how many real solutions there are to
x2+4x+1x=0x^2+4x+\frac{1}{x}=0x2+4x+x1=0-
Rearrange the equation as an intersection problem.
x2+4x=−1xx^2+4x=-\frac{1}{x}x2+4x=−x1 -
Think of sketching y=x2+4xy=x^2+4xy=x2+4x and y=−1xy=-\frac{1}{x}y=−x1 on the same axes.
-
The quadratic y=x2+4xy=x^2+4xy=x2+4x has roots at x=0x=0x=0 and x=−4x=-4x=−4, and its minimum is below the x-axis.
-
The reciprocal curve y=−1xy=-\frac{1}{x}y=−x1 has one branch in quadrant 2 and one branch in quadrant 4, with asymptotes x=0x=0x=0 and y=0y=0y=0.
-
Count the intersections from the sketch. Each intersection gives one real solution to the original equation.
Exam technique
In the exam
-
Start every sketch by finding the x-intercepts and y-intercept; label them clearly.
-
For transformations, track key points such as intercepts and turning points rather than trying to redraw from scratch.
-
Remember: f(x−a)f(x-a)f(x−a) moves right by aaa, while f(ax)f(ax)f(ax) changes x-coordinates by scale factor 1a\frac{1}{a}a1.
Self review
Check yourself
-
If f(x)f(x)f(x) has a minimum at (4,2)(4,2)(4,2), where is the minimum of y=f(2x)y=f(2x)y=f(2x)?
-
What are the asymptotes of y=3x+5−1y=\frac{3}{x+5}-1y=x+53−1?
-
Why does a graph usually touch, rather than cross, the x-axis at a repeated root such as (x−3)2(x-3)^2(x−3)2?

Recap questions
Test yourself with 5 quick questions on this guide. Answer them all correctly to complete it.
You've reached the end
Test yourself on this topic, or move on to the next guide.
How was this guide?