What you'll learn
- How sociologists distinguish poverty, income and wealth.
- How poverty and resources are distributed between different UK social groups.
- How to use concepts such as relative poverty, social exclusion, life chances and intersectionality in essays.
- How to evaluate official statistics and avoid over-simple “some groups are poor” answers.
Why distribution matters
In this topic, distribution means the pattern of who gets what in society. Sociologists are interested in whether valued resources — money, housing, security, health, education and status — are shared evenly or concentrated among some groups.
Distribution
Distribution is the way resources, rewards or disadvantages are spread across people or social groups in society.
This is central to the AQA theme of social differentiation, power and stratification: society is not just made up of individuals with different choices, but groups with different access to opportunities and resources.
It also links to socialisation, culture and identity. Poverty is not only about money; it can affect how people see themselves, how others label them, and whether they feel included in “normal” social life.
Poverty, income and wealth: do not mix them up
Income
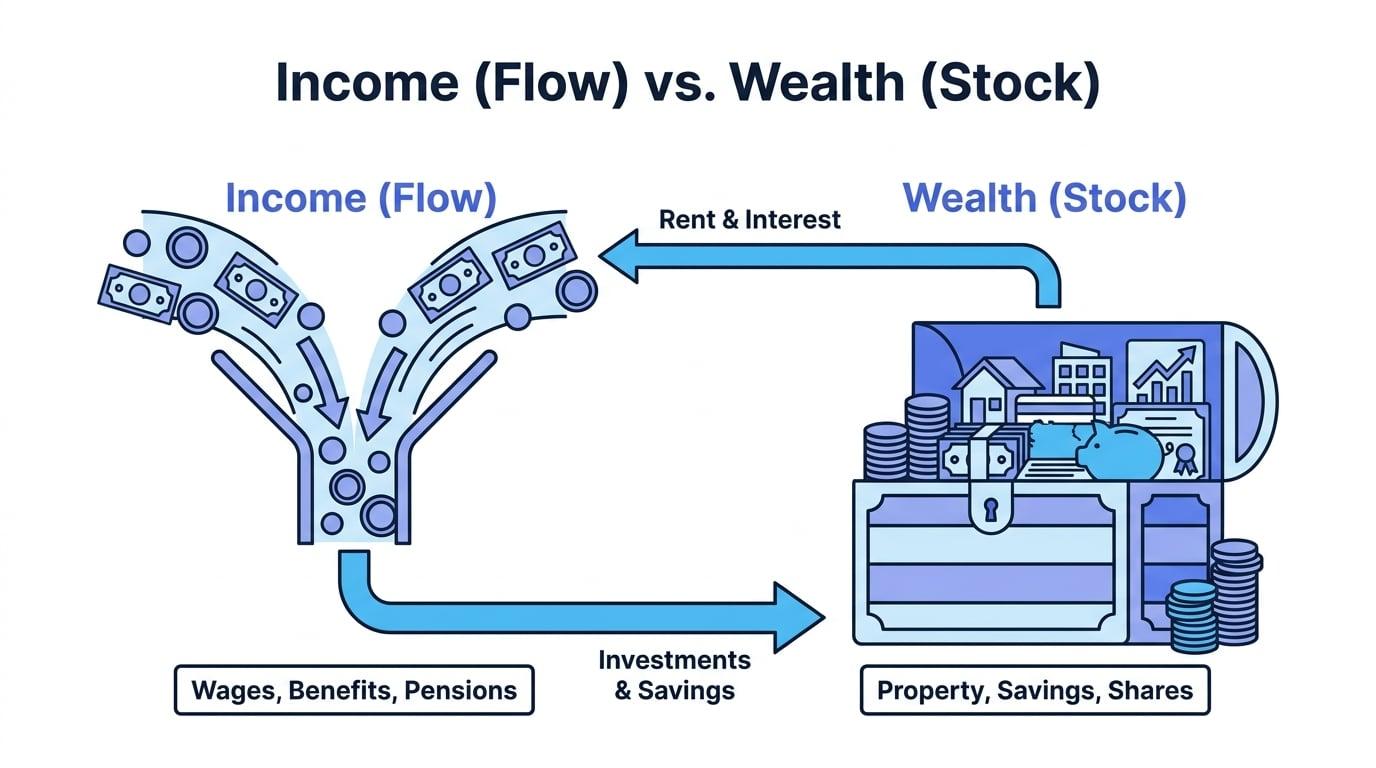
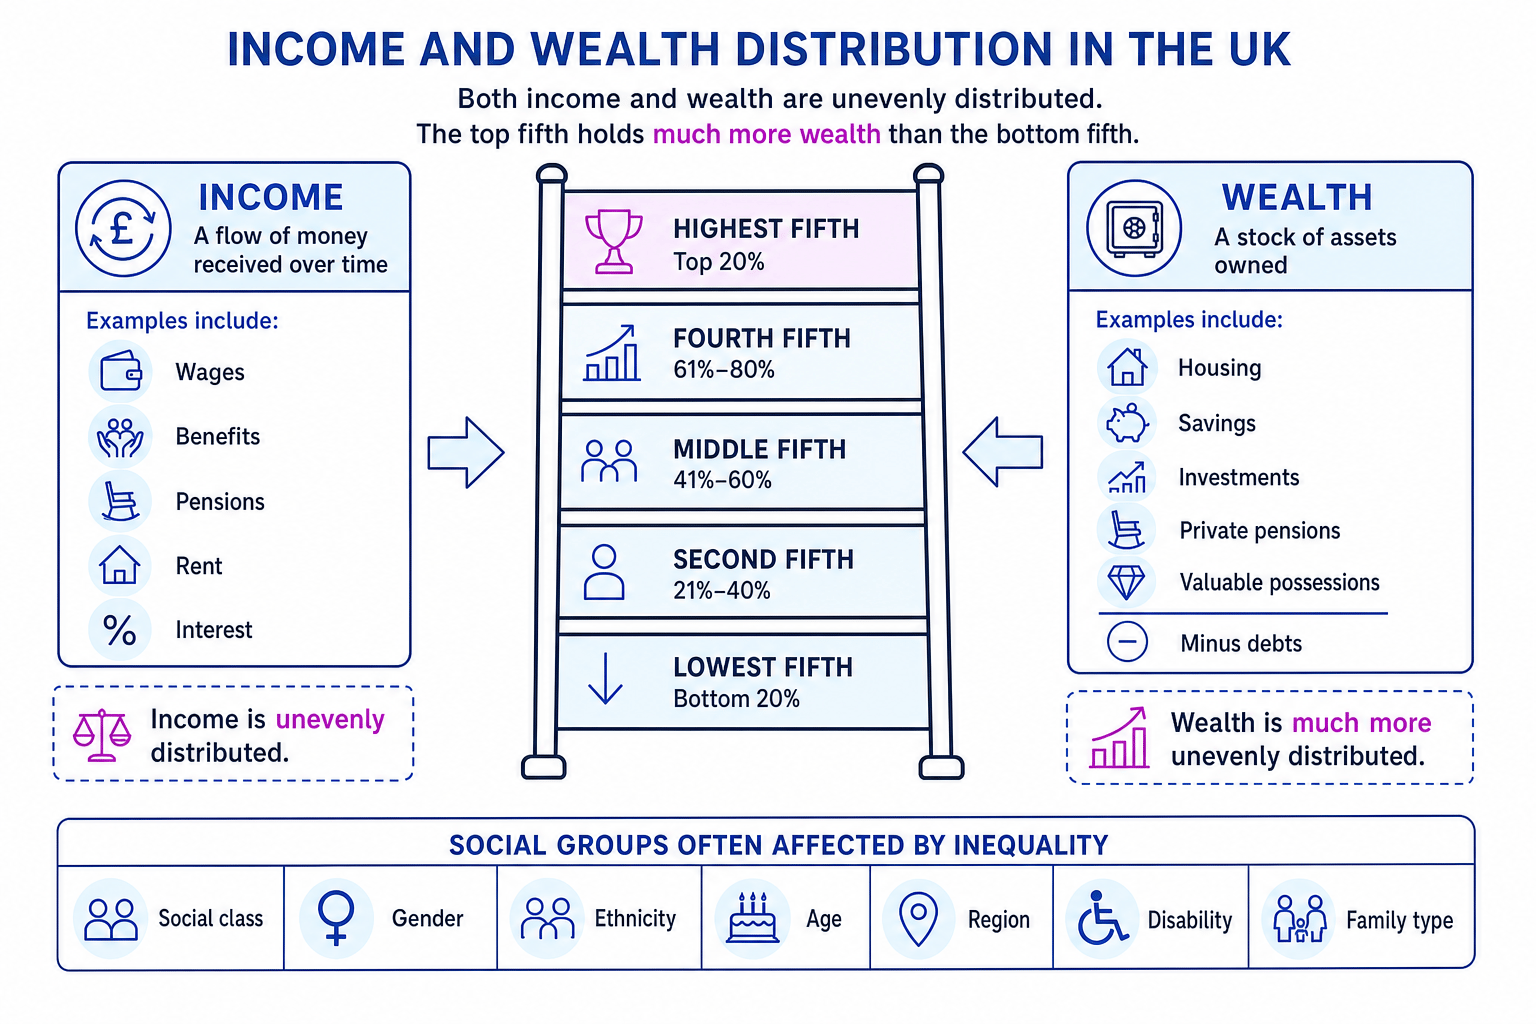
Income is money received over a period of time. This may come from wages, salaries, self-employment, benefits, pensions, rent, interest or dividends.
Wealth
Wealth is the total value of assets someone owns, minus debts. Assets include housing, savings, investments, private pensions and valuable possessions.
Poverty
Poverty means lacking the resources needed to meet basic needs or participate in ordinary social life.
Income is not the same as wealth
Income is money coming in; wealth is what you own. Wealth is usually more unequally distributed than income because it can be inherited, invested and accumulated over generations.
Absolute and relative poverty
Absolute poverty means lacking the basic resources needed for physical survival, such as food, shelter and clothing.
Relative poverty means being poor compared with the normal living standards of the society you live in. In the UK, sociologists and policymakers often focus on relative poverty because expectations change over time.
Relative poverty
Relative poverty is when people lack the resources to participate in the ordinary lifestyles, customs and activities considered normal in their society.
Peter Townsend argued that poverty should be understood as relative deprivation: people are poor if they cannot afford the diets, activities and living conditions that are customary in their society.
Mack and Lansley’s work on deprivation also used a consensual approach, asking the public what they considered necessities. This is useful because it avoids defining poverty only from the viewpoint of politicians or experts.
How sociologists measure distribution
Sociologists often use official statistics, such as data from the Office for National Statistics, the Department for Work and Pensions, the Census, or reports from organisations such as the Joseph Rowntree Foundation.
Common ways of comparing distribution include:
- Quintiles: dividing the population into five equal groups, each containing 20%.
- Deciles: dividing the population into ten equal groups, each containing 10%.
- Households below average income: often used to compare poverty before and after housing costs.
- Median income: the middle income when all households are ranked from lowest to highest.
Interpreting a poverty statistic
Suppose a source says: “Children in lone-parent households are more likely to be in relative poverty after housing costs than children in couple households.”
-
Identify the unit being compared: the statistic compares children, not adults, and it compares them by family type.
-
Notice the measure being used: “relative poverty after housing costs” means housing costs such as rent or mortgage payments have already been considered, which is important because housing is a major pressure on low-income families.
-
Apply the pattern sociologically: lone-parent households may rely on one adult income, face childcare costs, and be more vulnerable to insecure work or benefit changes.
-
Add evaluation: the statistic shows a pattern, but it does not prove every lone-parent family is poor, and it may hide differences by class, ethnicity, region or age.
Treating groups as all the same
Avoid writing as if “women”, “ethnic minorities” or “older people” all have identical experiences. Good sociology looks at patterns while recognising variation within groups.
Distribution by social class
Social class is one of the strongest predictors of poverty, income and wealth. People in higher social classes are more likely to have secure employment, occupational pensions, savings, property ownership and educational advantages.
Working-class people are more likely to experience:
- lower wages
- insecure or part-time work
- unemployment
- poor housing
- debt
- limited savings
- lower access to inherited wealth
Marxist sociologists link this to the structure of capitalism. Marx argued that the bourgeoisie own the means of production, while the proletariat sell their labour. From this view, inequality is built into the economic system.
Weberians give a more layered account. Weber argued that class, status and party all shape life chances. This helps explain why income and wealth are not only about workplace position, but also about qualifications, lifestyle, prestige and power.
Life chances
Life chances are the opportunities people have to access valued things such as education, health, secure work, housing and long life. Poverty reduces life chances; wealth expands them.
AO3 point: class remains powerful, but class alone is not enough. Gender, ethnicity, disability, age and region can interact with class to produce different outcomes.
Distribution by gender
Women are more likely than men to experience poverty at certain points in the life course. This is linked to the gender pay gap, unpaid care work, part-time employment, childcare responsibilities and pension inequalities.
Feminist sociologists argue that poverty is shaped by patriarchy, meaning a social system in which men hold more power than women. Walby identifies paid work and household labour as key areas where gender inequality is reproduced.
Women may also experience hidden poverty inside households. If household income is measured as if it is shared equally, statistics may miss cases where men control money or women sacrifice their own needs for children.
Use gender carefully
A strong answer does not simply say “women are poorer”. It explains mechanisms: caring responsibilities, labour market inequality, single parenthood, domestic financial control and pension gaps.
AO3 point: women’s employment and education have improved significantly, so gender inequality is not fixed. However, unpaid care and low-paid service work remain heavily gendered.
Distribution by ethnicity
Ethnic inequalities in poverty and income are significant in the UK, although patterns vary between ethnic groups. Some minority ethnic groups are more likely to experience unemployment, low pay, overcrowded housing or poverty.
Possible reasons include:
- discrimination in labour and housing markets
- differences in migration history
- language barriers for some first-generation migrants
- geographical concentration in high-cost urban areas
- educational and occupational inequalities
- Islamophobia or racism affecting opportunities
AO2 examples might include higher housing costs in London, racial discrimination in recruitment, or overcrowding among some minority ethnic households.
AO3 point: ethnicity should not be treated as a single category. For example, “Asian” or “Black” groups contain major differences by religion, class, migration background, education, gender and region.
Distribution by age
Age strongly affects income and wealth. Young adults may have low wages, insecure work, student debt and high rent. Older people may have lower incomes after retirement, but some have high levels of housing wealth.
This creates a complex pattern:
- Children are at risk because they depend on household income.
- Young adults may face insecure work and difficulty buying homes.
- Working-age adults may be affected by unemployment, caring roles or low pay.
- Older people may experience pensioner poverty, but some benefit from property ownership and occupational pensions.
Assuming all older people are poor
Some older people experience poverty, especially renters or those without private pensions. But many older households have more wealth than younger households because of home ownership and pension assets.
AO3 point: age inequality links to generational change. Rising house prices have made wealth accumulation harder for many younger people, while older homeowners may have benefited from asset inflation.
Distribution by region
Poverty and wealth are unevenly distributed across the UK. London contains very high incomes and wealth, but also high poverty after housing costs. Former industrial areas, some coastal towns and parts of the North East, Wales and the Midlands often show higher deprivation.
Regional inequality can be linked to:
- deindustrialisation
- differences in job opportunities
- housing costs
- transport links
- public and private investment
- educational and health inequalities
This connects to power and stratification because resources are not just unequally distributed between individuals, but also between places.
Distribution by disability and health
Disabled people are more likely to experience poverty because of barriers to employment, discrimination, extra living costs, inaccessible transport and dependence on benefits.
This is not simply an individual issue. The social model of disability argues that society disables people through barriers, rather than disability being only a personal medical condition.
AO3 point: official statistics may underestimate hardship if they measure income but not the extra costs of disability, such as heating, equipment, taxis or care.
Distribution by family type
Family structure affects poverty risks. Lone-parent households, large families and households with young children are more likely to experience poverty.
This may be because of:
- one adult income rather than two
- childcare costs
- limited working hours
- benefit caps or restrictions
- higher costs for food, clothing and housing
New Right thinkers such as Murray argue that welfare dependency and lone parenthood can contribute to poverty. However, critics argue this blames individuals and ignores low wages, childcare costs, gender inequality and housing markets.
Structure versus agency
Debates about poverty often ask whether hardship is mainly caused by individual choices and behaviour, or by wider social structures such as labour markets, patriarchy, racism and welfare policy.
Social exclusion
Poverty can lead to social exclusion, where people are shut out from normal participation in society. This might include being unable to afford school trips, internet access, transport, leisure activities, suitable clothing or social events.
Social exclusion
Social exclusion means being prevented from participating fully in society because of poverty, discrimination, poor health, lack of services or other barriers.
This is useful for essays because it shows poverty is not only economic. It affects identity, dignity, belonging and social relationships.
Evaluating evidence on distribution
Official statistics are useful because they can show large-scale patterns and trends over time. They are often reliable because the same measures are used repeatedly.
However, there are limitations:
- Definitions of poverty vary, so statistics can produce different pictures.
- Household income may hide unequal sharing within families.
- Some groups are undercounted, such as homeless people or undocumented migrants.
- Quantitative data can show patterns but not always lived experiences.
- Poverty “after housing costs” can look very different from poverty “before housing costs”.
Interpretivist sociologists may prefer qualitative research because it can reveal how poverty feels and how people manage stigma, shame and everyday survival. Positivists may prefer official statistics because they allow comparisons across large populations.
In the exam
-
Separate poverty, income and wealth clearly before comparing social groups.
-
Use specific groups and mechanisms: for example, “lone parents may face childcare costs and one adult income” is stronger than “families can be poor”.
-
Evaluate patterns by mentioning intersectionality, measurement problems, and differences within broad categories.
Check yourself
- Why is wealth usually more unequally distributed than income?
- How might gender and family type combine to increase poverty risk?
- What are two limitations of using official statistics to measure poverty?