What you'll learn
- How UK birth rates, death rates, family size and life expectancy have changed since 1900.
- Why Britain has an ageing population, and how this affects families and households.
- How migration and globalisation have reshaped family diversity and social identity.
- How to evaluate demographic evidence using AO1, AO2 and AO3.
Starting point: what is demography?
Demography is the study of populations: how many people there are, where they live, how old they are, and how this changes over time.
For Families and Households, demography matters because population trends shape everyday family life. For example, smaller families, longer lives and higher migration all affect household size, care responsibilities, kinship networks and family diversity.
Core demographic terms
- Birth rate means the number of live births per 1,000 people in the population per year.
- Death rate means the number of deaths per 1,000 people in the population per year.
- Fertility refers to actual childbearing patterns, often discussed through the average number of children women have.
- Life expectancy means the average number of years a person can expect to live.
- Infant mortality rate means the number of babies who die before their first birthday per 1,000 live births.
- Migration means movement of people from one area or country to another.
- Globalisation means the increasing interconnectedness of societies through flows of people, money, culture, work and information.
A timeline helps you see the “big picture”: since 1900, the UK has generally moved towards fewer births, fewer deaths, smaller families, longer lives, an older population and more diverse migration patterns.
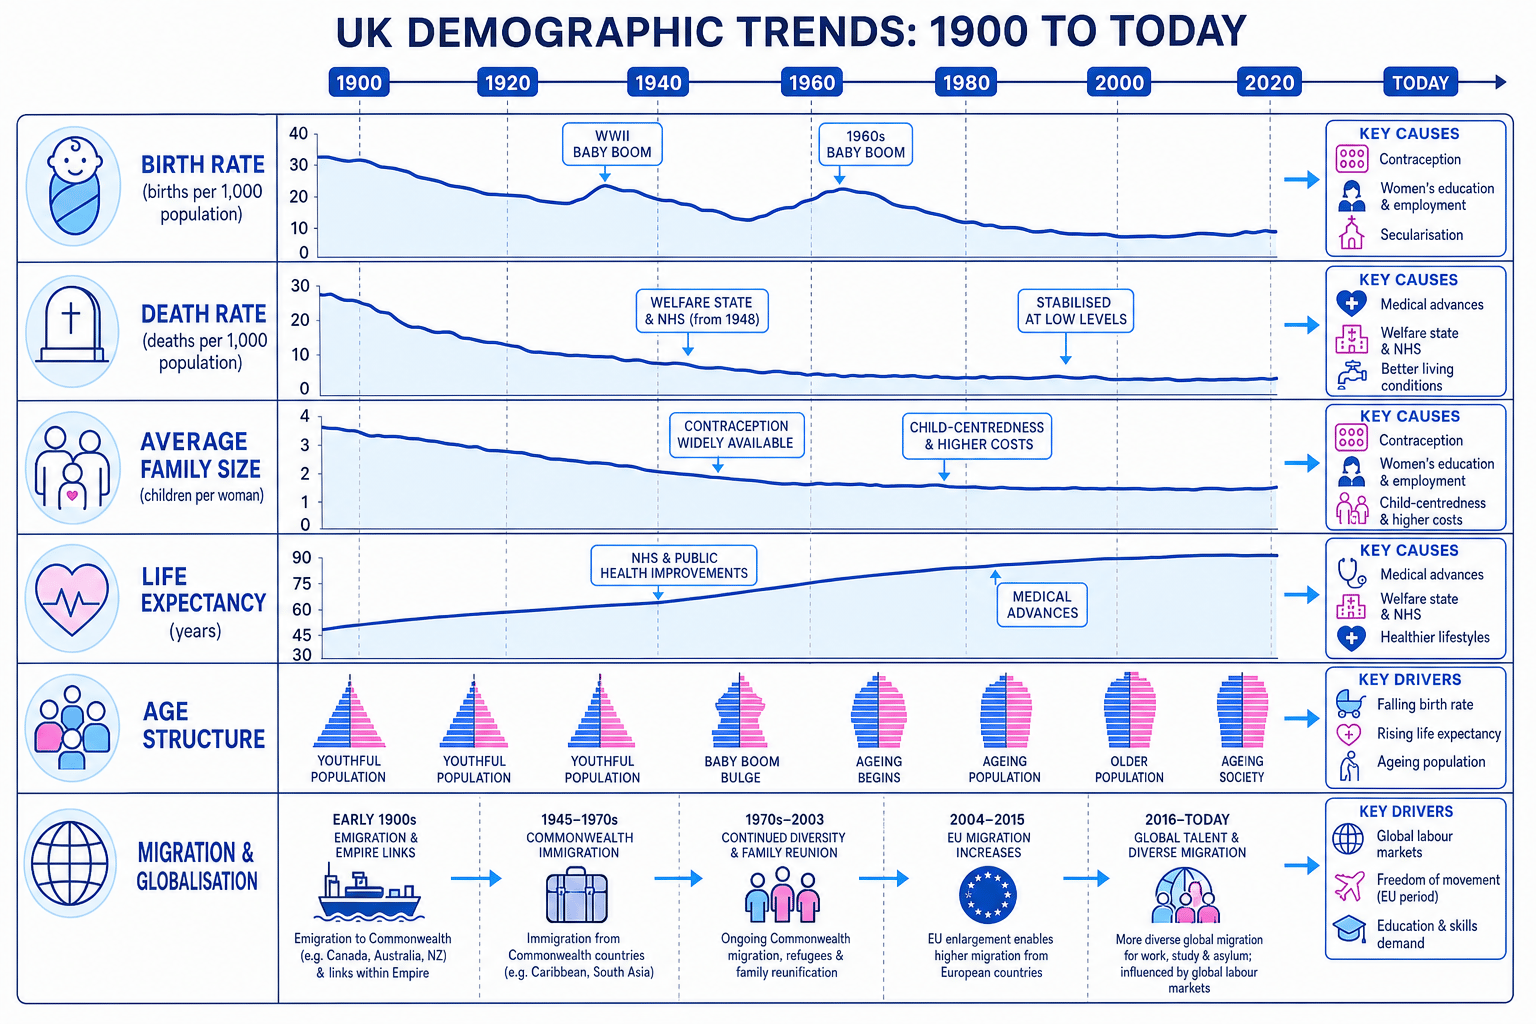
Birth rates: the long-term decline
Since 1900, the UK birth rate has generally fallen. There have been short-term increases, especially after the First and Second World Wars and during the 1960s “baby boom”, but the overall direction is downward.
Why have birth rates fallen?
One reason is contraception. Reliable contraception, especially the contraceptive pill from the 1960s, gave women and couples greater control over fertility. This links to the core theme of power: reproductive choices are not just biological, but shaped by law, medicine, gender relations and access to healthcare.
A second reason is the changing position of women. More women have entered higher education and paid employment, and many delay motherhood to build careers. Sharpe’s research on girls’ ambitions found a shift from prioritising marriage and children in the 1970s to careers and independence in the 1990s.
A third reason is child-centredness. Aries argued that modern childhood became more protected and emotionally valued. Children are now often seen as needing long-term emotional, educational and financial investment. This can encourage parents to have fewer children.
Secularisation also matters. As religious influence has declined for many people, traditional norms around marriage, sex and large families have weakened. Late modern theorists such as Beck and Giddens would link this to individualisation, where people increasingly construct their own life courses rather than simply following tradition.
Birth rates and social change
A falling birth rate is not just about “people choosing fewer children”. It reflects wider changes in gender roles, contraception, education, work, religion, housing costs and ideas about childhood.
Family size: smaller households and fewer children
The decline in fertility has contributed to smaller average family size. Large families were more common in the early twentieth century; today, one-child and two-child families are much more common.
This affects socialisation, culture and identity. Growing up with fewer siblings can change childhood experiences, family spending patterns and relationships between generations. It also affects family forms: there may be fewer horizontal kin, such as siblings, cousins, aunts and uncles, but more vertical relationships across generations because people live longer.
Sociologists sometimes describe this as the rise of the beanpole family: a long, thin family structure with several living generations but fewer people in each generation. Brannen has linked this to longer life expectancy and smaller family size.
Explaining a fall in family size
-
Start with the trend: UK families have generally become smaller because women, on average, have fewer children than in the early twentieth century.
-
Apply cultural change: Aries’ idea of child-centredness helps explain why parents may invest more time and money in each child, making large families less practical or desirable.
-
Apply gender change: women’s greater participation in education and employment can delay childbirth and reduce the number of children people plan to have.
-
Link to consequences: smaller families can create beanpole structures, with fewer siblings but more living grandparents and great-grandparents.
-
Evaluate: this pattern is not identical for all groups; fertility can vary by class, ethnicity, religion, region and migrant generation.
Death rates: why people are less likely to die young
The UK death rate fell sharply during the twentieth century, especially in the first half. This was linked to improvements in public health, sanitation, housing, nutrition, medical knowledge and the welfare state.
The creation of the NHS in 1948 is especially important for AO2 application. It made healthcare more accessible regardless of income, although health inequalities did not disappear.
McKeown argued that improved nutrition was a major reason for declining death rates, because better-fed people are more resistant to disease. Medical advances, such as antibiotics, vaccinations and safer childbirth, also reduced deaths from infectious disease.
However, death rates can be tricky to interpret. An ageing population can push the number of deaths up even if healthcare is improving, simply because there are more older people.
Assuming one trend has one cause
Do not explain falling death rates only by saying “better medicine”. Strong answers combine several factors: nutrition, sanitation, housing, welfare, NHS access, vaccination, workplace safety and changes in living standards.
Life expectancy: longer lives, but unequal lives
Life expectancy has increased dramatically since 1900. More people now survive into old age, and this has transformed family life. Grandparents are more likely to know grandchildren for longer, retirement lasts longer, and caring relationships may stretch across several generations.
But life expectancy is socially patterned. Women tend to live longer than men, although the gap has narrowed. Middle-class people generally have longer and healthier lives than working-class people. There are also regional inequalities: healthy life expectancy is often lower in deprived areas.
This is where social differentiation, power and stratification become central. Living longer is not simply an individual achievement; it is affected by income, housing, occupation, diet, stress, healthcare access and environmental conditions.
Recent evidence also complicates the “constant improvement” story. In the 2010s, UK life expectancy improvements slowed, and COVID-19 exposed deep inequalities in health risks, care work and housing.
The ageing population
An ageing population means the proportion of older people in the population is increasing. This happens mainly because people live longer and birth rates are lower.
Consequences for families
First, families may provide more care for elderly relatives. This can strengthen intergenerational bonds, but it may also create pressure, especially for women, who still do more unpaid care work on average.
Second, the “sandwich generation” may care for both children and elderly parents at the same time. This affects work, income, stress and gender roles.
Third, more older people live alone, especially older women, because women tend to outlive men. This raises questions about loneliness, pensions, housing and social care.
Sociological perspectives on ageing
Functionalist or New Right approaches may focus on the dependency ratio, meaning the relationship between people of working age and those dependent on them, such as children and retired people. They may argue that ageing creates pressure on pensions, taxation and the NHS.
Feminist sociologists would ask who performs the care work. They highlight that unpaid care is gendered and often invisible, even though society depends on it.
Postmodern or late modern approaches are more likely to emphasise diversity among older people. Some enjoy an active “third age” of travel, leisure and consumption, while others experience poverty, illness or isolation.
Ageing population evaluation
Avoid writing as if older people are automatically a “burden”. A balanced answer notes costs to pensions and healthcare, but also older people’s paid work, volunteering, childcare, tax contributions and emotional support within families.
Migration and globalisation
Migration has been central to UK demographic change since 1900. Britain has experienced both immigration and emigration, but the pattern has changed over time.
After the Second World War, migrants from Commonwealth countries, including the Caribbean and South Asia, helped rebuild Britain and staff key services such as transport and the NHS. The Windrush generation is a key AO2 example.
From the 1970s onwards, immigration controls became tighter, but family reunion continued. After 2004, EU enlargement increased migration from Eastern Europe. More recently, Brexit, global labour shortages, international students, refugees, and schemes for people from Ukraine and Hong Kong have shaped migration patterns.
Globalisation has made families more transnational. A transnational family is a family whose members live across national borders but maintain relationships through visits, money transfers, digital communication and care obligations. Hochschild’s idea of global care chains is useful here: women from poorer countries may migrate to do care work in richer countries, while leaving their own children in the care of relatives.
Migration also increases ethnic, religious and cultural diversity. Vertovec uses the term super-diversity to describe complex diversity involving not just ethnicity, but legal status, language, class, religion, locality and migration route.
Using official statistics carefully
Much demographic evidence comes from official statistics, especially the Census and the Office for National Statistics.
These sources are useful because they are large-scale, regular and often highly reliable. They allow sociologists to identify long-term trends in birth rates, death rates, ageing and migration.
However, they also have limitations. Categories can change over time, making comparisons difficult. Some groups may be undercounted, especially people in insecure housing or irregular migration situations. Migration data can be politically sensitive because definitions of “migrant”, “resident” and “net migration” matter.
Positivists often value demographic statistics because they allow patterns and correlations to be measured across whole populations. Interpretivists would add that statistics do not explain people’s meanings, motives or family experiences on their own.
Pulling it together for essays
The strongest answers do not treat each trend separately. They show how trends connect.
Falling birth rates and smaller families contribute to ageing. Longer life expectancy increases beanpole families and care responsibilities. Migration reshapes family diversity and can affect birth rates, household patterns and cultural identities. Globalisation connects UK families to wider labour markets, conflicts, education systems and communication technologies.
The big sociological link
Demographic trends are both causes and consequences of social change: they reflect shifts in gender, class, ethnicity, culture, welfare, medicine and global inequality, while also reshaping families and households.
In the exam
-
Use trend language: say whether a pattern has increased, decreased, stabilised or fluctuated since 1900.
-
Link each trend to families: for example, connect ageing to beanpole families, care work and single-person elderly households.
-
Evaluate with difference: avoid “the UK population” as if everyone is the same; bring in class, gender, ethnicity, region and migration status.
-
Use named ideas selectively: Aries for child-centredness, Sharpe for changing female ambitions, McKeown for nutrition, Beck or Giddens for individualisation, and Hochschild for global care chains.
-
Add methods evaluation when using statistics: official data are useful for large-scale trends, but categories, undercounting and interpretation can limit validity.
Check yourself
- Why has the UK birth rate generally fallen since 1900?
- How can an ageing population change family roles and household structures?
- What are two ways migration and globalisation have increased family diversity in the UK?
