What you'll learn
- What Dixit et al. (2012) investigated about alcohol risk behaviour in India.
- How an epidemiological study works in Health Psychology.
- The main biosocial factors linked with risky drinking.
- How to evaluate the study for AO3, including methods, ethics and applications.
Why this study matters
Dixit et al. (2012) is the contemporary study for this part of Edexcel Health Psychology. It looks at alcohol use as a real-world public health issue, not just as an individual “bad choice”.
The study is useful because it links health risk behaviour to both biological and social factors. This fits the wider Health Psychology idea that behaviour is shaped by the person, their environment, and wider cultural context.
Alcohol risk behaviour
Alcohol risk behaviour means patterns of drinking that increase the chance of harm, such as drinking frequently, drinking heavily, becoming dependent, or experiencing negative consequences because of alcohol.
Key background: epidemiology
Epidemiological study
An epidemiological study investigates the distribution and possible causes of health-related behaviours or conditions in a population. It usually looks for patterns, such as which groups are more likely to show a particular health risk.
Dixit et al. used an epidemiological approach because they wanted to identify who was most at risk of harmful alcohol use in urban and rural communities.
A key term here is prevalence. This means how common something is in a population at a particular time. For example, a study might estimate the prevalence of alcohol use in a rural sample and compare it with an urban sample.
Biosocial determinants
Biosocial determinants are factors that may influence behaviour and include both biological variables, such as age and sex, and social variables, such as education, occupation, socio-economic status and where someone lives.
The study in one flow
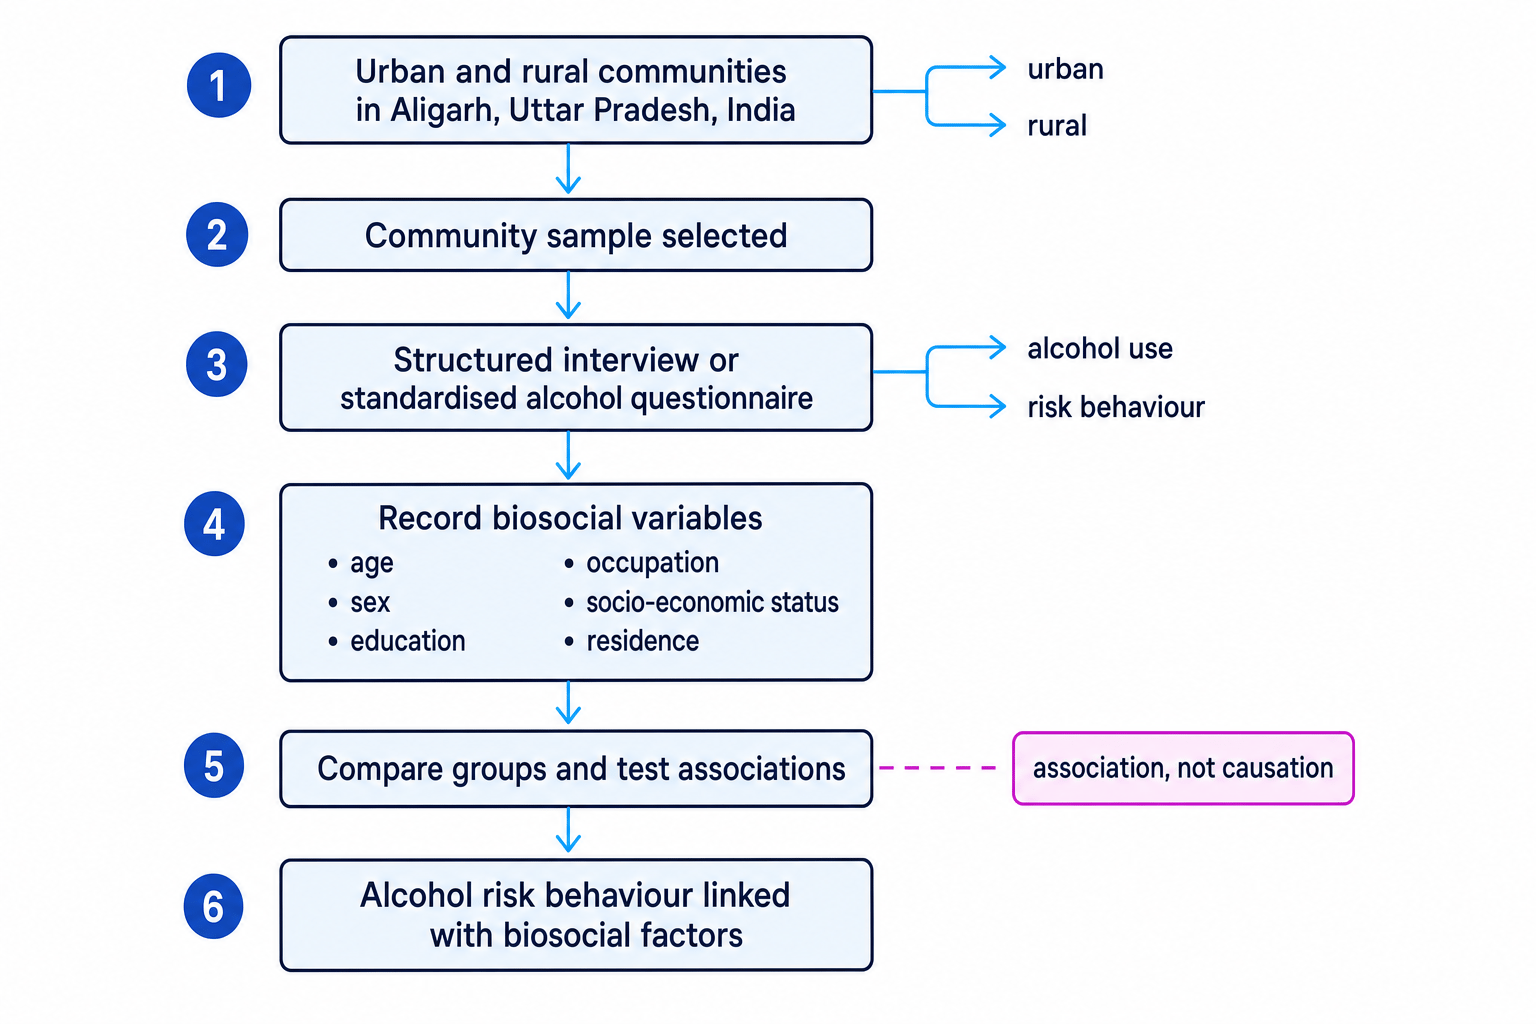
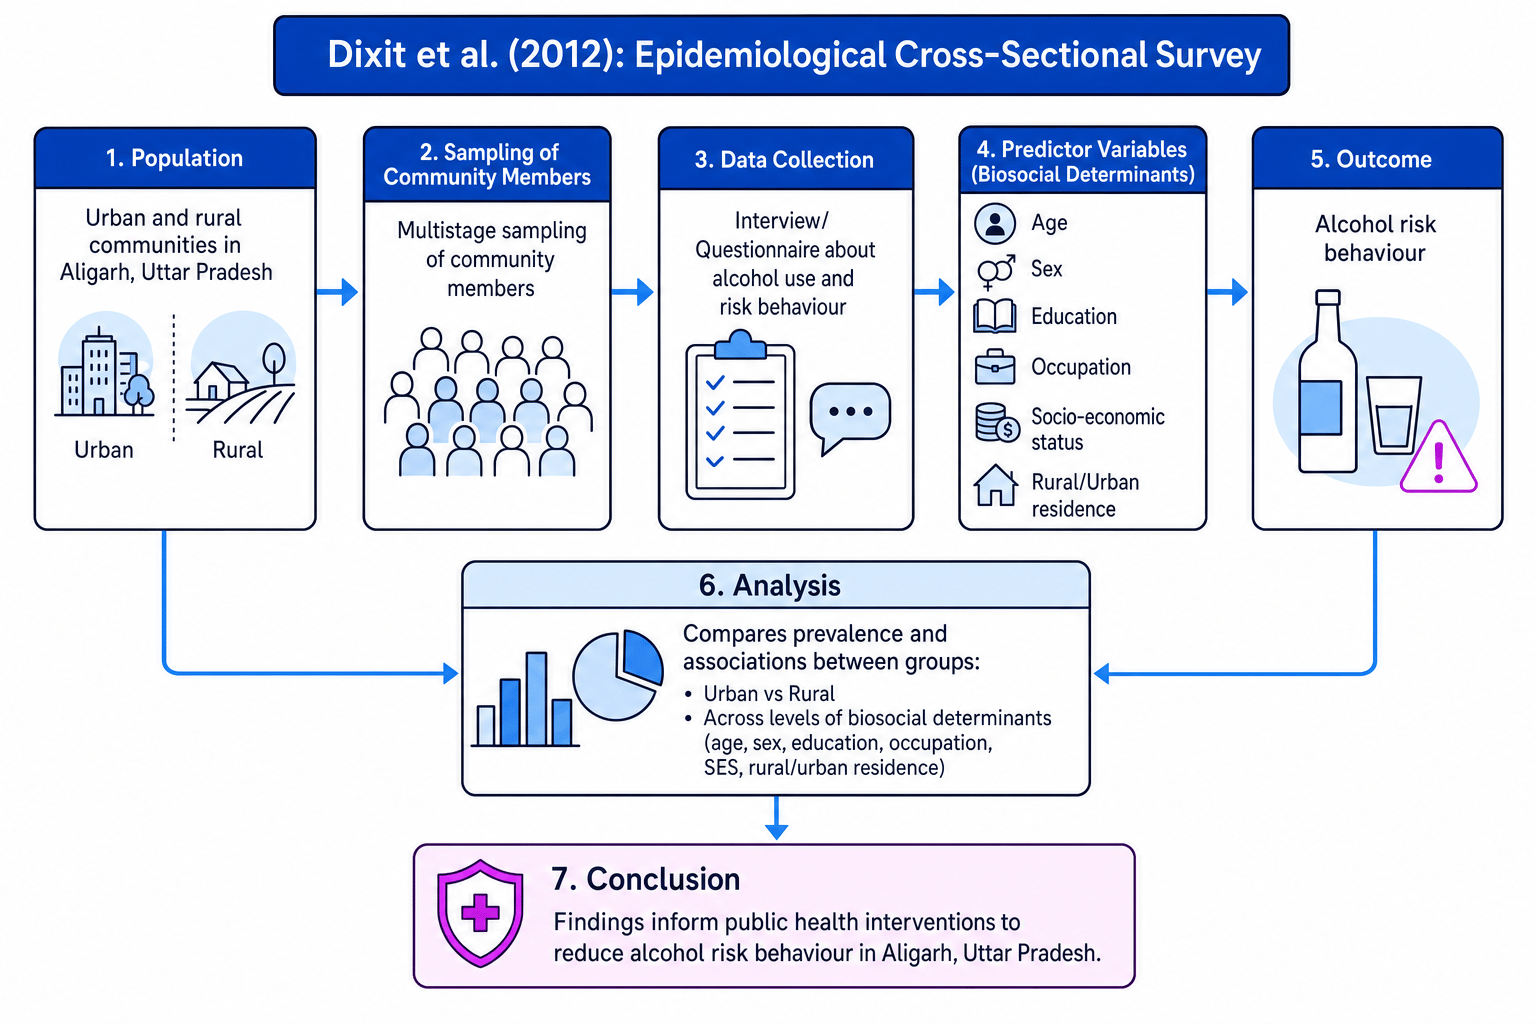
Dixit et al. studied alcohol risk behaviour in urban and rural communities in Aligarh, Uttar Pradesh, India. The basic logic was: sample people from the community, measure alcohol use, record biosocial variables, then look for patterns and associations.
AO1: What Dixit et al. did
Aim
The aim was to investigate biosocial determinants of alcohol risk behaviour in urban and rural communities of Aligarh, Uttar Pradesh.
In simpler terms, the researchers wanted to know whether alcohol risk behaviour was linked to variables such as:
- age
- sex
- education
- occupation
- socio-economic status
- rural or urban residence
Sample and setting
The study was carried out in community settings in Aligarh, in northern India. Participants came from both urban and rural communities.
This matters because urban and rural settings can differ in employment patterns, income, education, availability of alcohol, social norms and access to health information.
Research design
The study was a cross-sectional survey.
Cross-sectional design
A cross-sectional design collects data at one point in time. It can show patterns and associations, but it cannot show how behaviour changes over time.
This is different from a longitudinal design, which follows the same people over a period of time.
Data collection
Participants were asked about alcohol use and related risk behaviour, using structured interview or questionnaire methods. Studies of this type often use standardised alcohol screening tools, such as the Alcohol Use Disorders Identification Test, often shortened to AUDIT.
Standardised questionnaire
A standardised questionnaire uses the same questions and scoring system for each participant, making responses easier to compare across people and groups.
A standardised measure helps improve reliability, because each participant is assessed in a similar way.
Data analysis
The researchers compared alcohol risk behaviour across different groups. For example, they could compare:
- urban and rural participants
- males and females
- different age groups
- different education or occupational groups
This means the study is mainly looking at associations between variables.
Association
An association means two variables are related in some way. It does not automatically mean one variable causes the other.
Main findings
The overall pattern was that alcohol risk behaviour was not evenly spread across the population. It was associated with biosocial factors.
The key finding to remember is that risky alcohol use was linked with demographic and social variables, especially sex, age and rural or urban context. In many summaries of the study, alcohol risk behaviour is reported as more common among men and as varying according to social factors such as education, occupation and socio-economic status.
Core finding
Dixit et al. showed that alcohol risk behaviour is shaped by a combination of biological and social factors, rather than being simply an individual choice.
Interpreting the study carefully
A really important exam point is that this study is not experimental. The researchers did not manipulate a variable, such as alcohol availability, and then measure the effect.
Instead, they measured naturally occurring differences between people and groups.
Correlation is not causation
Do not write that living in a rural area, being male, or having a particular occupation directly “caused” alcohol risk behaviour. Dixit et al. found associations, not proven causes.
A better phrasing is:
Alcohol risk behaviour was associated with biosocial factors such as sex, age, education, occupation and residence.
Methods and statistics link
This study is a good place to connect Health Psychology with research methods.
If the researchers compare categories, such as urban vs rural and risk drinker vs non-risk drinker, they are dealing with categorical data. A suitable inferential test would usually be a chi-square test of association.
If they compared alcohol-risk scores between two independent groups, such as urban and rural participants, a Mann-Whitney U test could be appropriate if the data were ordinal or skewed. If the same participants were measured before and after an intervention, a Wilcoxon signed-ranks test would be suitable. If they correlated two ranked variables, such as socio-economic status rank and alcohol-risk score, Spearman’s rho could be used.
Skewed distribution
A skewed distribution is one where scores are not evenly balanced around the mean. Alcohol-use data are often skewed because many people may drink little or nothing, while a smaller number drink heavily.
Choosing the appropriate statistical test
-
Identify the first variable: residence has two categories, urban and rural, so it is nominal data.
-
Identify the second variable: alcohol-risk category could be risk behaviour present or risk behaviour absent, so this is also nominal data.
-
Because both variables are categorical and the question is whether they are associated, the appropriate test is the chi-square test of association.
-
The researcher would compare the observed value of χ2\chi^2χ2 with a critical value from a table, using a significance level such as p≤.05p \le .05p≤.05.
For Edexcel, remember the usual convention: p≤.05p \le .05p≤.05 is the default significance level. A stricter level such as p≤.01p \le .01p≤.01 reduces the chance of a Type I error — falsely finding a significant result — but can increase the chance of a Type II error — missing a real effect. A more lenient level such as p≤.10p \le .10p≤.10 does the opposite.
AO3: Strengths of the study
Real-world usefulness
A major strength is ecological validity. The study investigated alcohol risk behaviour in real communities, rather than in an artificial laboratory setting.
This makes the findings useful for public health planning. If particular groups are more at risk, interventions can be targeted more effectively.
Focus on multiple factors
The study is not purely biological or purely social. It uses a biosocial approach, which is more realistic because health behaviour is usually influenced by several interacting factors.
This is a strength because alcohol risk behaviour may be affected by age, sex, income, work, education, cultural expectations and availability of alcohol.
Practical application
The findings can help design health campaigns. For example, local health workers could target education and screening towards groups shown to be more at risk.
Application point
For AO2, link the study to prevention: if risky drinking clusters in particular groups, public health services can target those groups with education, screening and support.
AO3: Weaknesses of the study
Self-report problems
A key weakness is that alcohol use is a sensitive topic. Participants may under-report drinking because of embarrassment, stigma, religious norms or fear of judgement.
This is called social desirability bias.
Social desirability bias
Social desirability bias occurs when participants give answers that make them look better or more socially acceptable, rather than fully truthful answers.
This may reduce the validity of the findings, because the data may not perfectly reflect actual alcohol use.
Cross-sectional limitation
Because the data were collected at one point in time, the study cannot show changes over time. It also cannot establish cause and effect.
For example, lower socio-economic status might be linked with risk behaviour, but the study cannot prove whether social disadvantage contributes to drinking, drinking worsens disadvantage, or both are affected by other variables.
Cultural specificity
The study was conducted in Aligarh, Uttar Pradesh. This gives useful local detail, but it may limit generalisability to other countries or even other regions of India.
Alcohol use is strongly affected by culture, religion, gender norms, law, availability and local attitudes. Other studies in different settings may find different patterns, such as higher alcohol use in more urbanised or higher-income groups.
Ethical issues
Although this was not a laboratory experiment, ethics still matter.
Using the BPS Code of Ethics and Conduct principles, researchers should consider:
- Informed consent: participants should understand what the study is about.
- Right to withdraw: participants should be able to stop taking part.
- Confidentiality: alcohol use data should be kept private.
- Protection from harm: questions about alcohol may cause embarrassment or distress.
- Debriefing: participants should be given information after the study, ideally including support options if alcohol use is problematic.
There is unlikely to be a strong need for deception in this type of survey, so deception would be hard to justify.
How to use this study in essays
For AO1, keep your description clear:
- Dixit et al. investigated biosocial determinants of alcohol risk behaviour.
- The study was an epidemiological cross-sectional survey.
- It was carried out in urban and rural communities in Aligarh, Uttar Pradesh.
- It measured alcohol use and compared risk behaviour across biosocial variables.
- It found that alcohol risk behaviour was associated with factors such as sex, age, education, occupation, socio-economic status and residence.
For AO3, build a balanced paragraph:
- Strength: real-world community sample gives ecological validity and useful public health applications.
- Weakness: self-report alcohol data may be affected by social desirability bias.
- Weakness: cross-sectional associations cannot prove cause and effect.
- Ethics: confidentiality and protection from harm are especially important because alcohol use is sensitive.
In the exam
-
Describe the study as an epidemiological cross-sectional survey, not an experiment.
-
Use cautious language: write “associated with” or “linked to”, not “caused by”.
-
For evaluation, pair one methodological point with one application point: for example, self-report may reduce validity, but the findings are still useful for targeted public health interventions.
Check yourself
- What does “biosocial determinants” mean in the context of Dixit et al.?
- Why can’t this study prove that rural or urban residence causes alcohol risk behaviour?
- Which inferential test would be suitable for testing an association between two categorical variables?