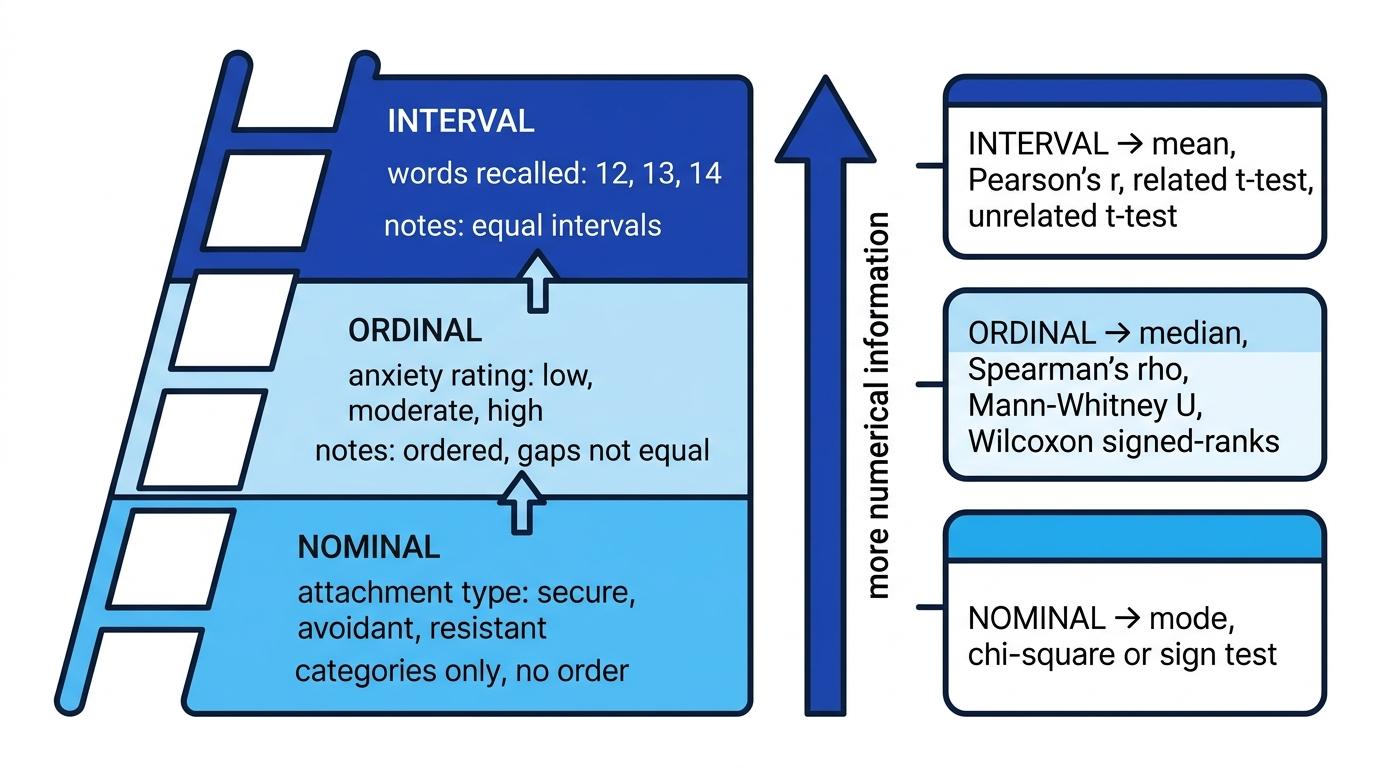
What you'll learn
- How to identify nominal, ordinal and interval data.
- Why the level of measurement affects which statistical test you can use.
- How to apply levels of measurement to AQA-style research scenarios.
- Common traps, especially when numbers look more “scientific” than they really are.
Why levels of measurement matter
In psychology, researchers collect data, meaning recorded information from participants, observations, questionnaires or experiments. A variable is anything that can vary, such as anxiety score, attachment type, reaction time or whether a participant obeys an instruction.
The level of measurement tells you what kind of information your data contains. This matters because it affects:
- what summary measure is appropriate, such as the mode, median or mean;
- what kind of conclusion you can draw;
- which inferential test you should choose. An inferential test is a statistical test used to decide whether a pattern in data is likely to be due to chance.
Level of measurement
A level of measurement is the type of scale used to record data, based on how much information the data gives you: categories only, ordered categories, or equal-interval numerical scores.
A useful way to remember the topic is as a ladder: each level gives you more information than the one below it.
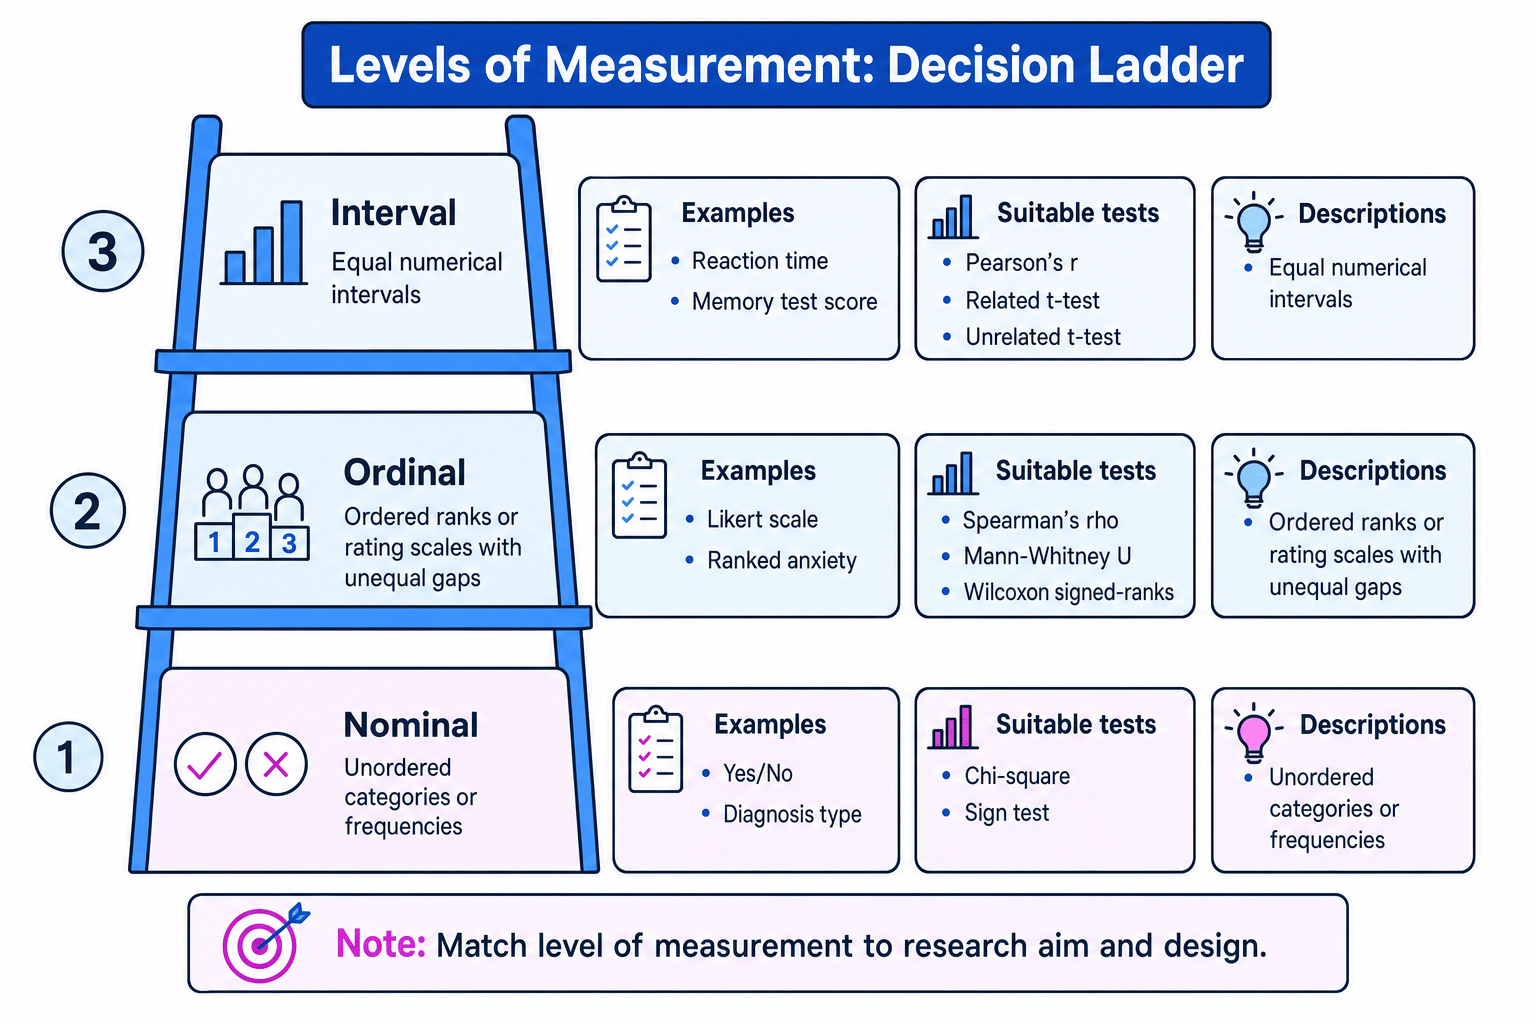
The ladder idea
Nominal data tells you “which category?”, ordinal data tells you “which order?”, and interval data tells you “how much difference?”
AO1: the three levels of measurement
1. Nominal data: named categories
Nominal data consists of categories with no natural order. The word “nominal” comes from “name”: you are naming groups, not ranking them.
Examples in psychology include:
- male/female/other gender categories, if used in a study;
- diagnosis type, such as phobia, depression or OCD;
- yes/no responses;
- whether a behaviour occurred or did not occur.
Nominal data is usually counted as frequencies, meaning how many people or observations fall into each category.
Nominal data
Nominal data is data in separate categories where the categories are different from each other but cannot be meaningfully placed in order.
For nominal data, the most suitable descriptive measure is usually the mode, which is the most common category. You cannot calculate a meaningful mean for categories such as “yes” and “no”.
Choosing Chi-square for nominal data
A researcher compares two groups: participants in a calm condition and participants in an anxiety condition. The outcome is whether each participant reports a false memory: yes or no.
- The outcome variable is “false memory: yes/no”, so the data is nominal because the responses are categories with no order.
- The researcher is comparing frequencies across two separate conditions, so the data can be arranged in a frequency table.
- The suitable inferential test is Chi-square because it tests whether there is an association between categorical variables.
- The researcher would look up the critical value for Chi-square using the degrees of freedom and the chosen significance level, usually p<0.05p < 0.05p<0.05.
- If the observed value is χ2=4.20\chi^2 = 4.20χ2=4.20 and the critical value is 3.84, then 4.20>3.844.20 > 3.844.20>3.84, so the researcher rejects the null hypothesis.
2. Ordinal data: ordered data
Ordinal data can be placed in order, but the gaps between points are not necessarily equal.
A common example is a Likert scale, which is a rating scale where participants choose a numbered response, such as 1 = strongly disagree to 5 = strongly agree. The numbers show order, but the psychological gap between 1 and 2 may not be the same as between 4 and 5.
Examples include:
- ranking participants from most anxious to least anxious;
- rating stress from 1 to 10;
- finishing positions in a task;
- questionnaire responses such as “never”, “sometimes”, “often” and “always”.
Ordinal data
Ordinal data is data that can be put in rank order, but where the differences between positions on the scale are not known to be equal.
For ordinal data, the median is often appropriate. The median is the middle value when scores are placed in order.
Choosing Spearman's rho for ordinal data
A psychologist investigates whether stress rating is related to sleep quality rating. Both variables are measured using 1 to 10 rating scales.
- Both variables are ordered ratings, so they are best treated as ordinal because the gaps between rating points may not be equal.
- The aim is to test a correlation, meaning a relationship between two variables, rather than a difference between groups.
- The suitable test is Spearman’s rho because it tests correlations using ordinal or ranked data.
- The researcher would look up the critical value for Spearman’s rho using the number of participants, the significance level and whether the hypothesis is one-tailed or two-tailed.
- If ρ=0.70\rho = 0.70ρ=0.70 and the critical value is 0.648, then 0.70>0.6480.70 > 0.6480.70>0.648, so the null hypothesis of no relationship is rejected.
Numbers do not automatically mean interval
A numbered scale is not automatically interval data. Participant ID numbers, football shirt numbers and 1-to-5 agreement ratings use numbers, but they do not necessarily have equal psychological gaps.
3. Interval data: equal intervals
Interval data uses a numerical scale where the gaps between points are equal. This means the difference between 10 and 12 is the same size as the difference between 18 and 20 on that scale.
Examples in psychology may include:
- reaction time in a cognitive task;
- score on a standardised memory test;
- total score on a well-designed psychological scale, if the stem treats it as a numerical score;
- IQ score, often treated as interval at A-Level.
Interval data
Interval data is numerical data measured on a scale with equal intervals between values, so differences between scores are meaningful.
For interval data, researchers can usually calculate the mean, which is the arithmetic average. They may also calculate measures of spread such as the range or standard deviation.
AQA Psychology does not require you to use ratio data as a separate category. Some real-world measures, such as reaction time, have a true zero, but for AQA test-choice purposes they are normally handled as interval-level quantitative data.
Choosing a related t-test for interval data
A researcher measures the same participants’ memory scores before and after a sleep intervention. The score is out of 40 on a standardised test.
- The dependent variable is a numerical test score, so it can be treated as interval because differences between scores are meaningful.
- The same participants are tested twice, so the design is related: the scores are paired within each participant.
- The suitable inferential test is a related t-test because the researcher is comparing two related sets of interval data.
- The researcher would look up the critical value of t using the degrees of freedom, the significance level and whether the hypothesis is one-tailed or two-tailed.
- If t=2.71t = 2.71t=2.71, df=19df = 19df=19 and the two-tailed critical value at p<0.05p < 0.05p<0.05 is 2.093, then 2.71>2.0932.71 > 2.0932.71>2.093, so the null hypothesis is rejected.
Matching level, aim and design to a test
Level of measurement is important, but it is not the only decision. You also need to consider the aim and design.
The aim is what the researcher is testing: a difference or a relationship. The design is how the participants are arranged. In an independent groups design, different participants are used in each condition. In a repeated measures design, the same participants are used in all conditions. In a matched pairs design, different participants are paired on relevant characteristics.
| Research situation | Usual level | Suitable AQA test |
|---|---|---|
| Association between categories | Nominal | Chi-square |
| Related nominal data showing direction of change | Nominal | Sign test |
| Difference between two unrelated groups using ranks/ratings | Ordinal | Mann-Whitney U |
| Difference between two related conditions using ranks/ratings | Ordinal | Wilcoxon signed-ranks |
| Correlation using ranks/ratings | Ordinal | Spearman’s rho |
| Difference between two unrelated groups using interval data | Interval | Unrelated t-test |
| Difference between two related conditions using interval data | Interval | Related t-test |
| Correlation using interval data | Interval | Pearson’s r |
Three-question test choice
Ask: Is the data nominal, ordinal or interval? Then ask: Is the researcher testing a difference or a correlation? Finally ask: Are the scores related or unrelated?
Interval is not the whole decision
Interval data does not automatically mean “use a t-test”. Parametric tests such as t-tests and Pearson’s r also assume the data is suitable in other ways, such as not being extremely skewed.
AO2: applying levels to scenarios
In exam scenarios, focus on the actual data recorded, not just the topic of the study.
If a researcher asks, “Did the participant conform: yes or no?”, the data is nominal. If the researcher asks participants to rate how much pressure they felt from 1 to 10, the data is ordinal. If the researcher records a standardised anxiety score from a validated scale and treats score differences as equal, the data may be interval.
A useful rule is: you can lose information, but you cannot magically gain it back. Interval scores can be converted into ranks, and ranks can be converted into categories, but each conversion loses detail. For example, exact memory scores can be ranked from highest to lowest, but once you only know the rank, you no longer know how large the score differences were.
AO3: evaluating measurement choices
A strength of understanding levels of measurement is that it improves validity, which means whether the study measures what it claims to measure. If a researcher uses a suitable level and test, their conclusion is more justified.
A second strength is transparency. Clear operationalisation — defining exactly how a variable is measured — makes research easier to replicate and evaluate.
However, psychological variables are often difficult to measure cleanly. A 1-to-10 “anxiety” rating may look precise, but one participant’s 8 may not mean the same as another participant’s 8. This reduces confidence that the scale has equal intervals.
Another limitation is that simplifying behaviour into categories can lose important detail. For example, coding responses as simply “aggressive” or “not aggressive” may ignore intensity, context and frequency.
There is also an ethical angle. When data includes sensitive categories such as diagnosis, trauma history or mental health status, researchers must protect confidentiality, meaning participants’ personal data should not be identifiable. Clear measurement should not come at the cost of participant dignity or protection from harm.
In the exam
- Identify the actual data recorded first: categories, ranks/ratings, or equal-interval scores.
- Link level of measurement to the research aim and design before naming a statistical test.
- When using critical values, state the decision rule clearly: reject the null hypothesis only if the result reaches the required significance level, usually p<0.05p < 0.05p<0.05.
Check yourself
- A researcher records whether each participant obeyed or disobeyed an instruction. What level of measurement is this?
- Why is a 1-to-7 happiness rating usually treated as ordinal rather than interval?
- Which test would you choose for a correlation between two ranked variables?