What you'll learn
- What a correlation is and when psychologists use one.
- How to interpret scattergrams and correlation coefficients.
- How significance is judged for a correlation at p<0.05p < 0.05p<0.05.
- Strengths, limitations, and ethical issues in correlational research.
Starting point: variables and co-variables
A variable is anything that can vary between people, situations, or measurements — for example, hours of sleep, anxiety score, age, or test performance.
In an experiment, researchers manipulate an independent variable and measure a dependent variable. In a correlation, they do not manipulate anything. Instead, they measure two variables as they naturally occur.
Correlation
A correlation is a statistical relationship between two measured variables. In correlation analysis, these variables are often called co-variables because neither one is deliberately changed by the researcher.
For example, a psychologist might measure students’ revision hours and their test scores to see whether the two are related.
The big idea
Correlation analysis tells you whether two co-variables are related, but it does not show that one variable causes the other.
Positive, negative, and zero correlations
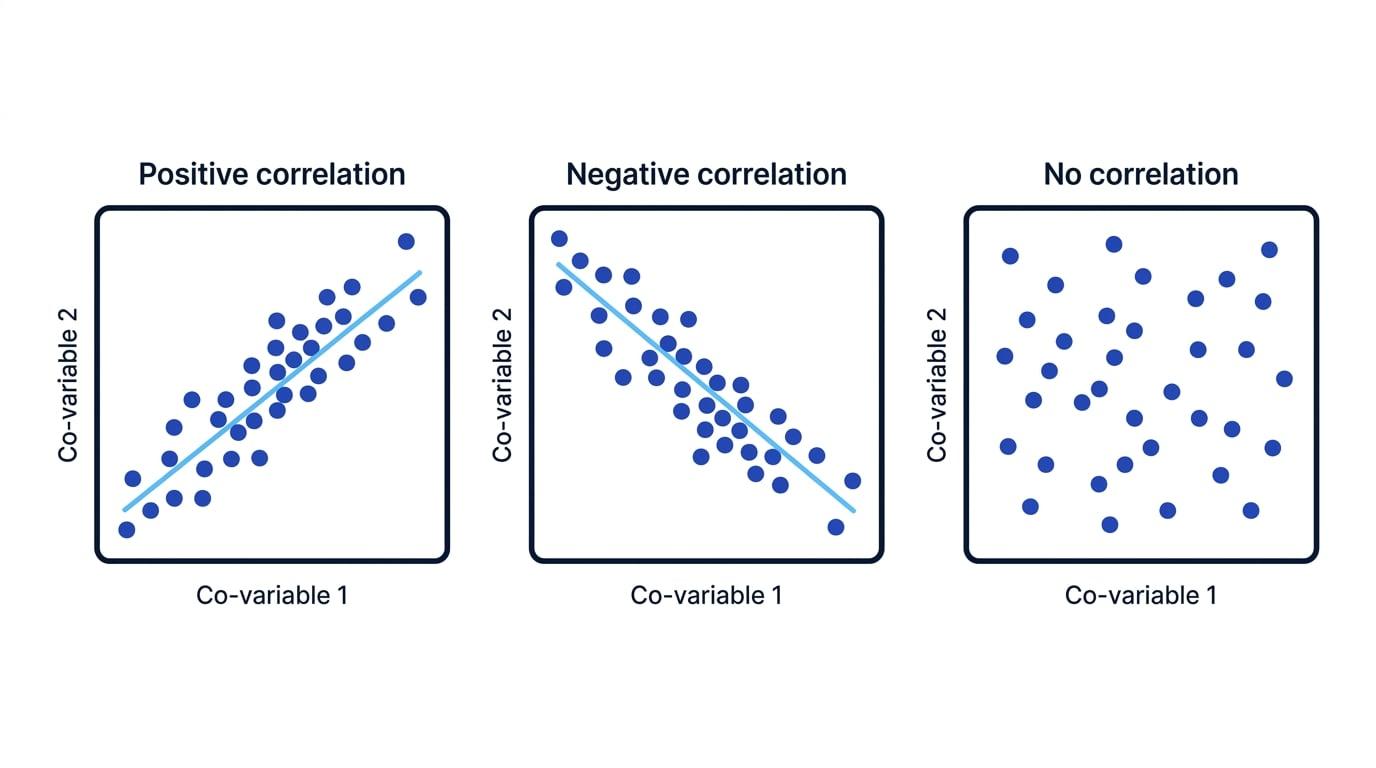
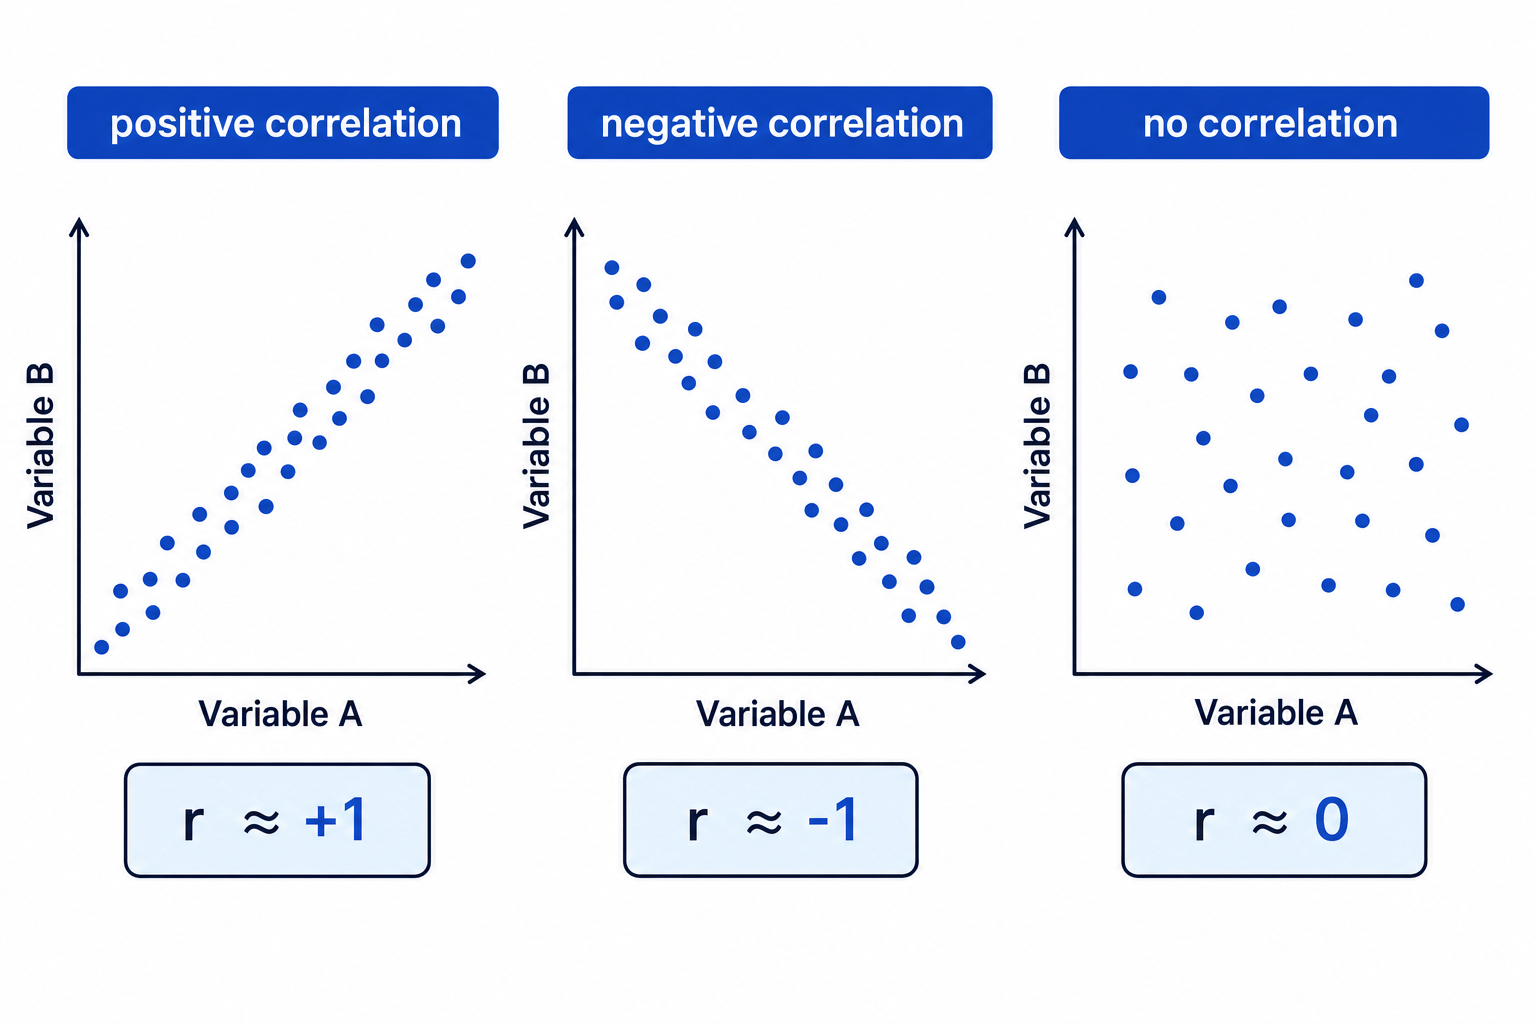
A positive correlation means that as one co-variable increases, the other also tends to increase. For example, more revision hours may be associated with higher test scores.
A negative correlation means that as one co-variable increases, the other tends to decrease. For example, higher stress may be associated with fewer hours of sleep.
A zero correlation or no correlation means there is no clear relationship between the two co-variables.
The easiest way to see this is on a scattergram, which is a graph where each dot represents one participant’s pair of scores.
Describing the relationship in a scattergram
A researcher plots students’ weekly exercise hours on the horizontal axis and self-rated mood score on the vertical axis. The dots generally rise from bottom-left to top-right.
- The upward pattern shows a positive correlation because higher exercise hours tend to go with higher mood scores.
- The dots are fairly close to an imaginary line, so the relationship is likely to be moderate or strong, not weak.
- The correct conclusion is: “There is a positive association between exercise and mood.” You should not conclude that exercise caused the mood improvement.
Correlation coefficients
A correlation coefficient is a number that summarises the direction and strength of a correlation.
Correlation coefficient
A correlation coefficient is a numerical value between -1 and +1 that shows the direction and strength of the relationship between two co-variables.
The sign tells you the direction:
- A positive value means a positive correlation.
- A negative value means a negative correlation.
- A value near zero means little or no linear relationship.
The size tells you the strength:
- Values close to +1 or -1 are strong.
- Values close to 0 are weak.
- +1 and -1 are perfect correlations, which are rare in real psychological data.
A rough guide:
| Coefficient size | Usual interpretation |
|---|---|
| Around 0.00 to 0.19 | Very weak or negligible |
| Around 0.20 to 0.39 | Weak |
| Around 0.40 to 0.59 | Moderate |
| Around 0.60 to 0.79 | Strong |
| Around 0.80 to 1.00 | Very strong |
Read coefficients in two moves
First read the sign to decide the direction. Then read the distance from zero to judge the strength.
Interpreting a coefficient in context
A psychologist finds a correlation coefficient of r=−0.68r = -0.68r=−0.68 between exam anxiety score and exam performance.
- The negative sign shows a negative correlation, so higher anxiety is associated with lower exam performance.
- The value 0.68 is reasonably far from zero, so the relationship is strong, though not perfect.
- The interpretation should stay correlational: “Students with higher anxiety tended to achieve lower exam scores.” It should not say anxiety definitely caused lower scores.
Turning correlation into causation
Do not write “X caused Y” from a correlation. The relationship might work the other way round, or a third variable may explain both.
Why correlation does not prove cause and effect
Correlation analysis is useful, but it has a major limitation: it cannot establish causation, meaning it cannot prove that one variable directly produces a change in the other.
There are two main problems.
The direction problem
If sleep and memory scores are correlated, poor sleep might reduce memory performance. But it is also possible that anxiety about poor memory disrupts sleep. Correlation alone cannot tell you which direction the effect runs.
The third-variable problem
A third variable is an unmeasured factor that may influence both co-variables. For example, stress might reduce sleep and also reduce memory performance, creating a correlation between sleep and memory even if neither directly causes the other.
Explaining a third-variable problem
A study finds a positive correlation between children’s vocabulary scores and time spent reading at home.
- One possible interpretation is that reading at home improves vocabulary.
- A second possible interpretation is that children with stronger vocabulary enjoy reading more, so they choose to read more often.
- A third-variable explanation is that parental education may influence both the number of books at home and children’s vocabulary development.
Choosing the right correlation test
At A-level, you may need to recognise which statistical test suits a correlational design.
Pearson’s r is a parametric correlation test used when both co-variables are measured at least at interval level and the relationship is roughly linear. Interval data has equal intervals between scores, such as a questionnaire scale treated as numerical.
Spearman’s rho is a non-parametric correlation test used with ordinal data, meaning ranked data, or when interval data does not meet the assumptions for Pearson’s r. It is often the safer A-level answer when data are ranks.
Linear relationship
A linear relationship is a relationship that can be represented reasonably well by a straight line on a scattergram.
Zero does not always mean no relationship
A coefficient near zero means little or no linear relationship. There could still be a curved relationship that a simple correlation coefficient fails to capture.
Testing whether a correlation is significant
A correlation coefficient describes a relationship in your sample. To decide whether it is likely to reflect a real relationship in the population, psychologists use statistical significance.
Statistical significance
A result is statistically significant if it is unlikely to have occurred by chance, using a chosen probability level such as p<0.05p < 0.05p<0.05.
The usual A-level significance level is p<0.05p < 0.05p<0.05. This means there is less than a 5% probability of obtaining the result if the null hypothesis is true. The null hypothesis states that there is no significant relationship between the co-variables.
For correlations, the number of pairs of scores is called NNN. If 15 participants each provide two scores, N=15N = 15N=15.
Testing whether a correlation is significant
A psychologist predicts a negative correlation between exam anxiety rank and exam performance rank. Ten students are tested. Spearman’s rho gives rs=−0.72r_s = -0.72rs=−0.72. The critical value for N=10N = 10N=10, one-tailed, at p<0.05p < 0.05p<0.05 is 0.564.
- Spearman’s rho is appropriate because the data are ranked, so the level of measurement is ordinal, and the design is correlational because each student provides two scores.
- The hypothesis is directional because it predicts a negative correlation, so a one-tailed critical value is used.
- Compare the size of the observed coefficient with the critical value: 0.72 is greater than 0.564.
- Check the sign: the observed result is negative, which matches the predicted direction.
- The result is significant at p<0.05p < 0.05p<0.05, so the null hypothesis is rejected. There is a significant negative correlation between anxiety rank and performance rank.
Counting the wrong N
In a correlation, NNN is the number of pairs of scores, not the total number of individual scores. Ten participants each giving two scores still gives N=10N = 10N=10, not 20.
AO2: applying correlation to scenarios
When applying correlation analysis, identify:
- the two co-variables being measured;
- whether the relationship is positive, negative, or absent;
- whether the relationship appears weak, moderate, or strong;
- whether the conclusion avoids causal language.
For example, if a scenario says “as self-esteem scores increase, depression scores decrease”, you should describe this as a negative correlation. If the points are tightly clustered around a downward trend, it is a strong negative correlation.
Useful sentence frame
“The data show a [positive/negative] correlation between [co-variable 1] and [co-variable 2], meaning that as [co-variable 1] increases, [co-variable 2] tends to [increase/decrease]. However, this does not demonstrate causation.”
AO3: evaluating correlation analysis
Strengths
Correlation is useful when it would be unethical or impossible to manipulate variables. For example, a psychologist cannot ethically make participants experience long-term stress just to test its effect on mental health, but they can measure naturally occurring stress and wellbeing.
Correlation can also be useful for prediction. If two variables are strongly related, one score may help predict another. For example, high scores on a screening questionnaire might predict risk of later anxiety difficulties, helping services offer support earlier.
Correlational studies can be quicker and less artificial than experiments because they often measure naturally occurring variables in real-world settings.
Limitations
The main weakness is that correlation cannot show cause and effect. The direction problem and third-variable problem limit the conclusions researchers can draw.
Correlations can also be distorted by outliers, which are unusual extreme scores. A single very unusual participant may make the relationship look stronger or weaker than it really is.
Another issue is measurement validity, meaning whether a measure really assesses what it claims to measure. If a “stress questionnaire” is poorly designed, any correlation involving stress scores will be less meaningful.
Finally, a statistically significant correlation is not automatically important. With a very large sample, a weak relationship may become significant but have limited real-world value.
Ethical considerations
Correlational research often avoids harmful manipulation, which is a strength. However, ethical issues still matter, especially when measuring sensitive topics such as mental health, trauma, aggression, or substance use.
Researchers should gain informed consent, protect confidentiality, remind participants of their right to withdraw, and avoid unnecessary distress. If any deception is used about the aim of the study, participants should be fully debriefed afterwards. For sensitive questionnaires, researchers may need to provide support information or signposting.
In the exam
- State the relationship clearly: positive, negative, or no correlation, plus strength if a coefficient or scattergram is provided.
- Use cautious language such as “associated with” or “related to”; avoid causal claims unless the question gives experimental evidence.
- If judging significance, identify the test, level of measurement, NNN, significance level, critical value, and whether the null hypothesis should be rejected.
Check yourself
- What does a correlation coefficient of r=+0.82r = +0.82r=+0.82 tell you about direction and strength?
- Why can a strong correlation still fail to prove cause and effect?
- When would Spearman’s rho be more suitable than Pearson’s r?