What you'll learn
- What a correlation is and how psychologists use co-variables.
- How to recognise positive, negative and no correlation from a scattergram.
- Why correlations are different from experiments, especially for cause and effect.
- How to evaluate correlational research for AO3: strengths, limitations and ethics.
The big idea: looking for relationships
In psychology, researchers often want to know whether two things are related. For example:
- Is there a relationship between hours of sleep and memory test performance?
- Is there a relationship between social media use and anxiety scores?
- Is there a relationship between age and reaction time?
A correlation is used when the researcher measures two variables and analyses whether they are related.
Correlation
A correlation is a statistical technique used to analyse the relationship between two measured variables. These two variables are called co-variables because they vary together.
Co-variable
A co-variable is one of the two variables measured in a correlational study. Unlike an experiment, neither co-variable is deliberately manipulated by the researcher.
For example, if a researcher records each student’s hours of revision and their psychology test score, the two co-variables are hours of revision and test score.
Identifying co-variables
A psychologist investigates whether people who sleep for longer perform better on a memory test.
- The first measured variable is hours of sleep, because each participant reports how long they slept.
- The second measured variable is memory test score, because each participant completes the same test.
- These are co-variables, not an independent variable and dependent variable, because the psychologist has not manipulated sleep time.
Operationalising co-variables
Before collecting data, researchers must be clear about exactly how each co-variable will be measured.
Operationalisation
Operationalisation means defining a variable precisely so it can be measured. For example, “stress” could be operationalised as a score on a 20-item stress questionnaire.
This matters because vague co-variables make research difficult to replicate and weaken validity. “Social media use” could mean minutes per day, number of posts, number of platforms used, or self-rated dependence.
Be precise
In exam scenarios, avoid vague wording like “memory” or “stress” if you can. Say how it is measured, such as “number of words correctly recalled” or “score on a standardised stress questionnaire”.
Scattergrams: seeing the relationship
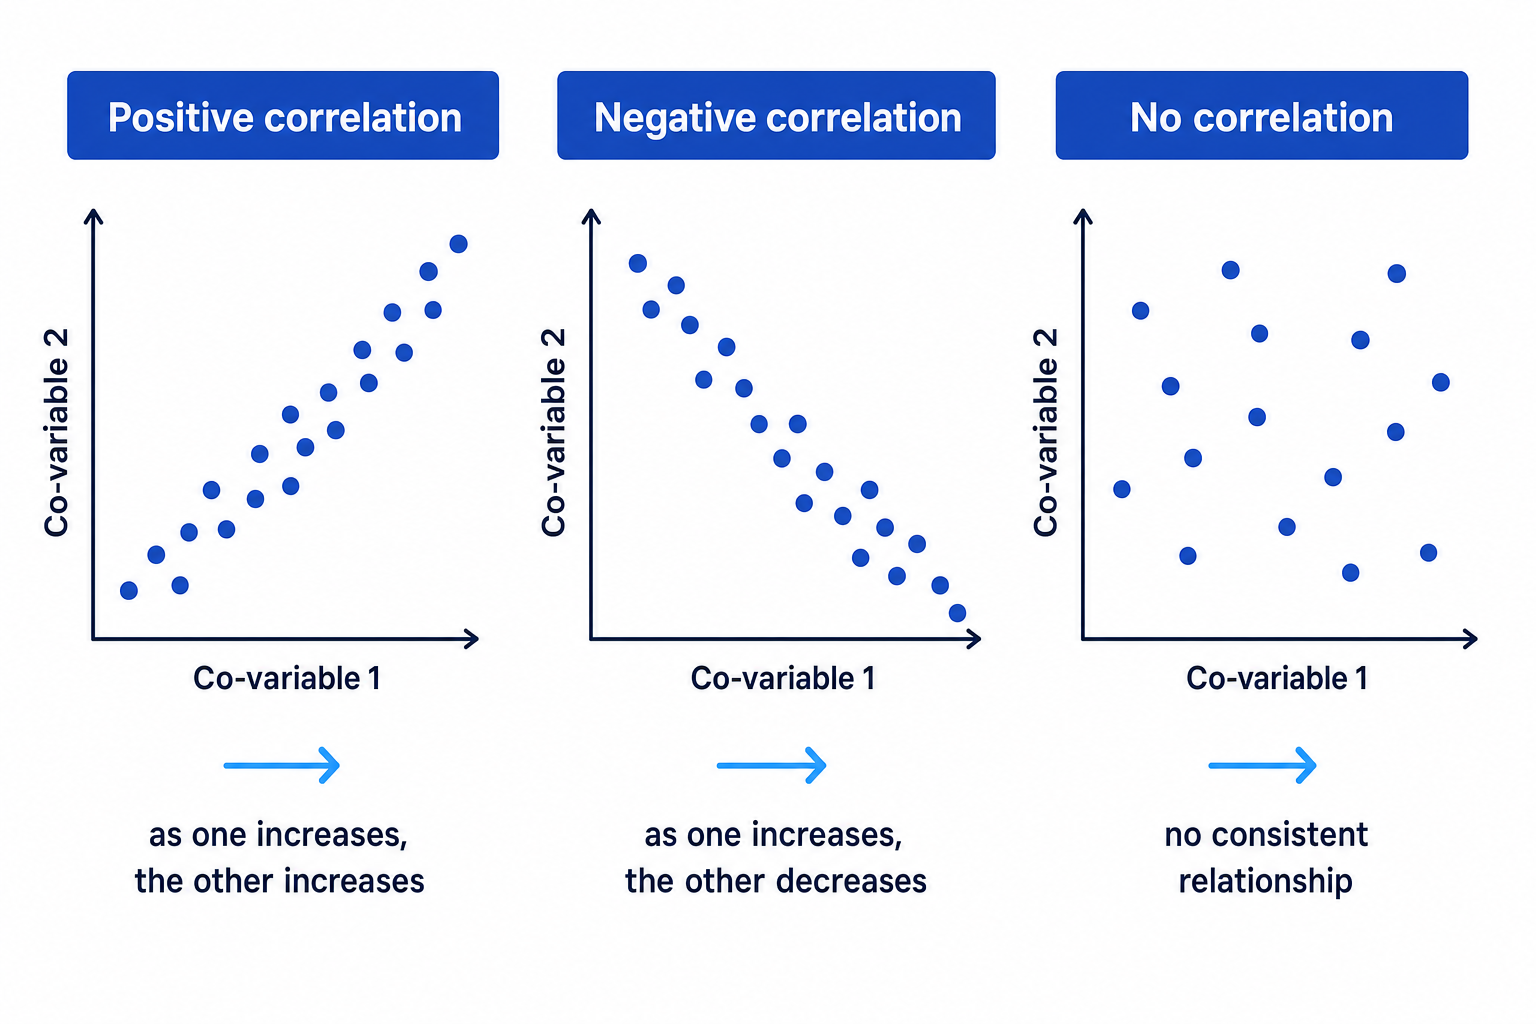
A scattergram, also called a scatterplot, is a graph used to display correlational data. Each participant contributes one point on the graph: one score for co-variable 1 and one score for co-variable 2.
The pattern of dots helps you judge the direction and strength of the relationship.
Positive correlation
A positive correlation occurs when both co-variables increase together. As one goes up, the other tends to go up too.
Example: as hours of revision increase, test scores may also increase.
Negative correlation
A negative correlation occurs when one co-variable increases while the other decreases.
Example: as sleep deprivation increases, concentration scores may decrease.
No correlation
No correlation means there is no consistent relationship between the two co-variables.
Example: shoe size and obedience score would probably show no meaningful relationship.
Interpreting a scattergram
A scattergram shows that students with higher caffeine intake tend to have lower sleep quality scores.
- The points slope downwards from left to right, so the relationship is negative.
- The points are fairly close to an imaginary straight line, so the relationship is likely to be moderate or strong.
- The correct conclusion is that caffeine intake is associated with lower sleep quality, not that caffeine definitely causes poor sleep.
Correlation coefficients
A correlation coefficient is a number that summarises the direction and strength of a correlation.
Correlation coefficient
A correlation coefficient is a statistical value, usually written as rrr or rsr_srs, ranging from -1 to +1. The sign shows the direction of the relationship, and the size shows its strength.
- A value close to +1 means a strong positive correlation.
- A value close to -1 means a strong negative correlation.
- A value close to 0 means little or no linear relationship.
The sign tells you the direction. The distance from zero tells you the strength.
Direction is not strength
Do not say that r=+0.40r = +0.40r=+0.40 is “stronger” than r=−0.80r = -0.80r=−0.80 just because it is positive. The negative correlation is stronger because 0.80 is further from zero than 0.40.
Interpreting correlation coefficients
A researcher finds these correlations: r=+0.76r = +0.76r=+0.76 between revision and test score, and r=−0.22r = -0.22r=−0.22 between screen time and test score.
- r=+0.76r = +0.76r=+0.76 is positive, so higher revision is associated with higher test scores.
- r=+0.76r = +0.76r=+0.76 is fairly close to +1, so this is a strong positive relationship.
- r=−0.22r = -0.22r=−0.22 is negative but close to zero, so screen time has only a weak negative relationship with test score in this sample.
Correlations are not experiments
This is one of the most important exam points.
Experiment
An experiment is a research method where the researcher manipulates an independent variable to see its effect on a dependent variable, while trying to control other variables.
In a correlation:
- the researcher measures two co-variables;
- there is no independent variable;
- there is no dependent variable;
- participants are not usually allocated to conditions;
- the researcher cannot show cause and effect.
In an experiment, the researcher deliberately changes something. For example, Loftus and Palmer (1974) manipulated the verb used in a question about a car accident, then measured estimated speed. That is different from simply measuring two naturally occurring variables. Ethical issues in experiments may include deception and the need for debriefing; correlational studies still require consent, confidentiality and protection from harm.
No manipulation, no cause
A correlation can show that two variables are related, but it cannot prove that one variable causes the other.
Why correlation does not prove causation
There are two classic problems.
First, there is the directionality problem. If A and B are correlated, A might cause B, but B might also cause A.
Second, there may be a third variable. This is another factor that influences both co-variables.
Explaining why causation cannot be claimed
A study finds a positive correlation between social media use and anxiety scores.
- One possible explanation is that high social media use increases anxiety, perhaps through comparison with others.
- Another possible explanation is the reverse direction: anxious people may use social media more often for reassurance or distraction.
- A third variable, such as loneliness, poor sleep or exam stress, might increase both social media use and anxiety.
- Therefore, the researcher should conclude that social media use and anxiety are associated, not that one definitely causes the other.
Saying caused when you mean related
In correlational research, write “is associated with”, “is related to”, or “is linked to”. Avoid “causes”, “affects” or “leads to” unless the study is an experiment.
Analysing the relationship statistically
Once data have been collected and plotted, researchers may use an inferential statistical test to see whether the correlation is likely to be significant.
Statistical significance
A result is statistically significant if it is unlikely to have occurred by chance, usually judged against a probability level such as p<0.05p < 0.05p<0.05.
For correlations, two common tests are:
- Spearman’s rho: used for ordinal data, ranked data, or when the relationship may not meet the assumptions for Pearson’s test.
- Pearson’s r: used for interval or ratio data when the relationship is linear and the data meet parametric assumptions.
Ordinal, interval and ratio data
Ordinal data can be put in order, such as ranks or rating scales. Interval data have equal intervals between values, such as many test scores. Ratio data have equal intervals and a true zero, such as time taken to complete a task.
Choosing a correlation test
A psychologist studies the relationship between ranked stress level and ranked sleep quality in 12 students. The obtained value is rs=−0.68r_s = -0.68rs=−0.68. The hypothesis is non-directional, and the significance level is p<0.05p < 0.05p<0.05.
- The design is correlational because the same participants provide paired scores on two co-variables.
- The level of measurement is ordinal because the data are ranks, so the appropriate test is Spearman’s rho.
- The researcher would look up the critical value for Spearman’s rho with N = 12, two-tailed, at p<0.05p < 0.05p<0.05.
- If the critical value is 0.59, compare the size of the obtained value using ∣rs∣=0.68|r_s| = 0.68∣rs∣=0.68.
- Because 0.68 is greater than 0.59, the researcher rejects the null hypothesis and concludes there is a significant negative correlation.
Writing hypotheses for correlations
A hypothesis is a testable prediction.
For a correlation, the hypothesis predicts a relationship between two co-variables, not a difference between conditions.
- Directional hypothesis: predicts the direction of the relationship, such as “There will be a positive correlation between hours of revision and test score.”
- Non-directional hypothesis: predicts a relationship but not the direction, such as “There will be a correlation between hours of revision and test score.”
- Null hypothesis: predicts no significant relationship between the co-variables.
Correlation hypothesis wording
Use the phrase “relationship between” or “correlation between”. If your hypothesis says “participants in condition A will score higher than condition B”, you are writing an experimental hypothesis, not a correlational one.
Evaluation of correlations
Strengths
Correlations are useful when experiments would be unethical or impractical. For example, it would be unethical to manipulate severe stress to see whether it affects mental health, but researchers can measure naturally occurring stress and wellbeing.
They can also be efficient. Large amounts of data can be collected using questionnaires, psychological tests or existing records, making correlations useful for identifying patterns and generating future research questions.
Correlations have real-world applications. They can help psychologists identify risk factors, such as relationships between poor sleep and low mood, or between stress and workplace absence.
Limitations
The biggest weakness is that correlations cannot establish cause and effect. Directionality and third variables reduce internal validity.
Correlations can also be affected by outliers, which are unusual extreme scores. A single extreme participant can make a relationship appear stronger or weaker than it really is.
Another issue is that some relationships are non-linear. A correlation coefficient may be low even when there is a clear curved relationship. For example, moderate stress might improve performance, while very low and very high stress reduce performance.
Finally, correlations depend heavily on how co-variables are operationalised. If “aggression” is measured using a weak questionnaire, the study may lack validity even if the statistical analysis is correct.
A low correlation does not always mean no relationship
A correlation coefficient mainly summarises a straight-line relationship. If the true relationship is curved, a coefficient near zero may be misleading.
Ethical considerations
Correlational studies are often less risky than experiments because the researcher is not manipulating participants’ experiences. However, ethics still matter.
Researchers should gain informed consent, protect confidentiality, allow the right to withdraw, avoid psychological harm, and provide a debrief. This is especially important when co-variables involve sensitive topics such as anxiety, attachment, offending, drug use or mental health.
In the exam
- When asked to describe a correlation, mention two co-variables, a relationship, and the fact that neither variable is manipulated.
- When interpreting a result, comment on both direction and strength, then use cautious language such as “associated with”.
- When comparing with experiments, focus on the key contrast: experiments can support cause and effect because they manipulate an IV; correlations cannot.
Check yourself
- What is the difference between a co-variable and an independent variable?
- Why can a strong correlation still fail to prove cause and effect?
- Which statistical test would you choose for a correlation using ranked data?
